


Created
: 2022.09.13


In MetaTrader 4 (MT4) and MetaTrader 5 (MT5), you can add shapes such as rectangles, triangles, and ellipses to your charts. These shapes can be customized in color and positioned behind the chart. Use these tools to enhance your market analysis with greater precision.
Here we will look at how to display and set up the shapes like rectangle, triangle, and ellipse on MT4/MT5.
Switch between MT4/MT5 tabs to check the steps for each.
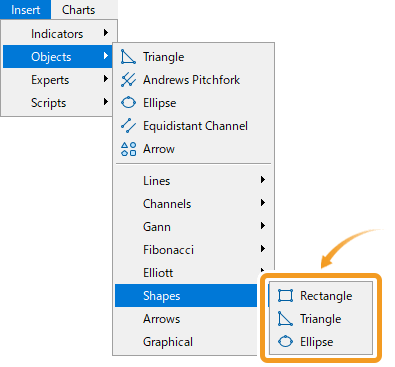
Click "Insert" in the menu. Hover the pointer over "Shapes" and select a shape.
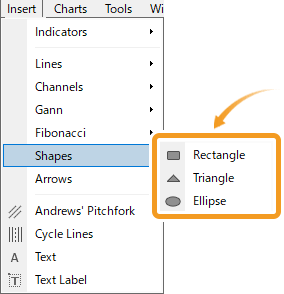
Rectangle


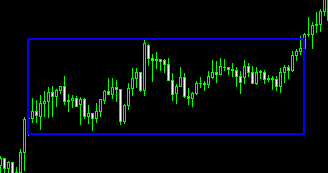
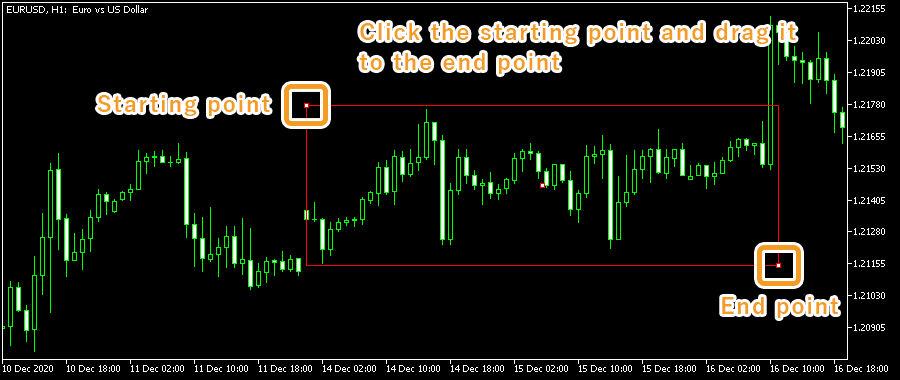
Highlight a specific part of the chart with a rectangle.
Triangle
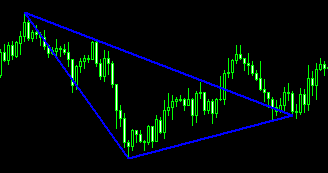
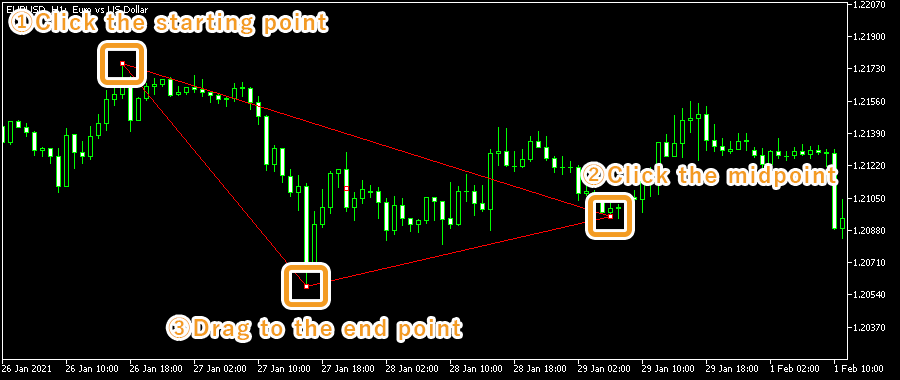
Highlight a specific part of the chart with a triangle.
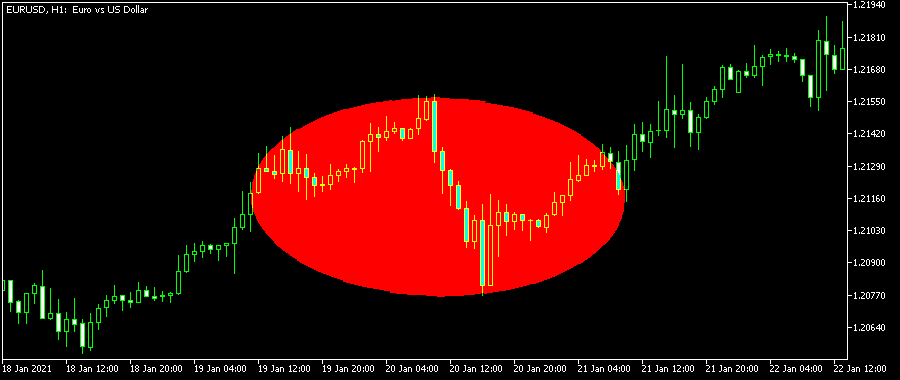
Ellipse
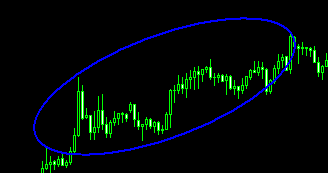
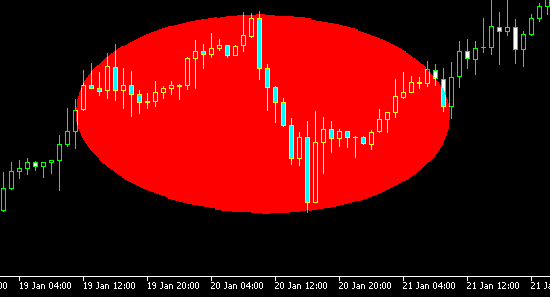
Highlight a specific part of the chart with an ellipse.
The methods for drawing vary by shape. Here, we'll cover how to draw a rectangle, triangle, and ellipse.
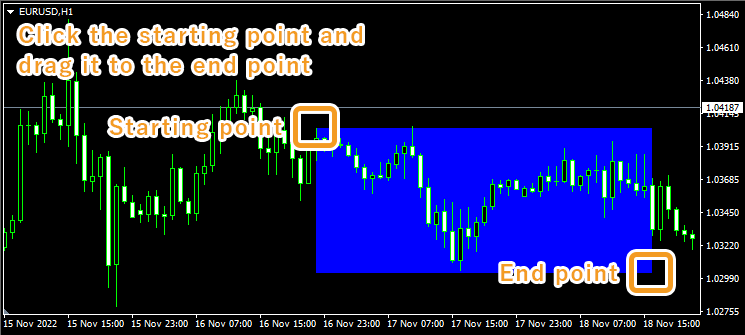
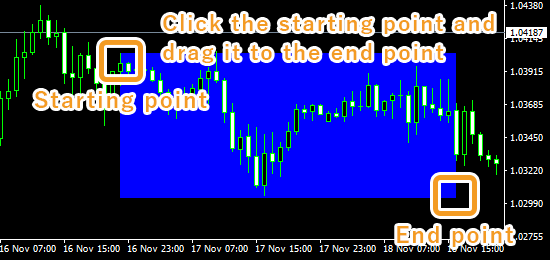
Click the starting point on the chart and drag it to the end point to create a rectangle.
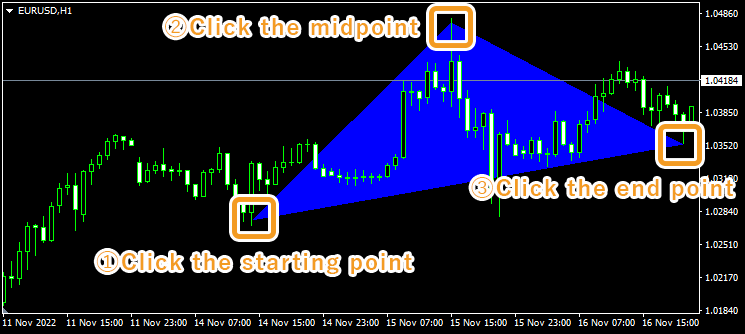
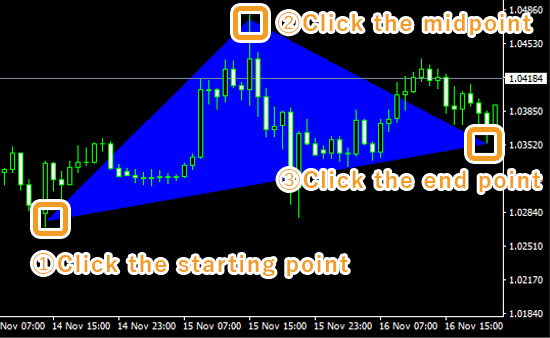
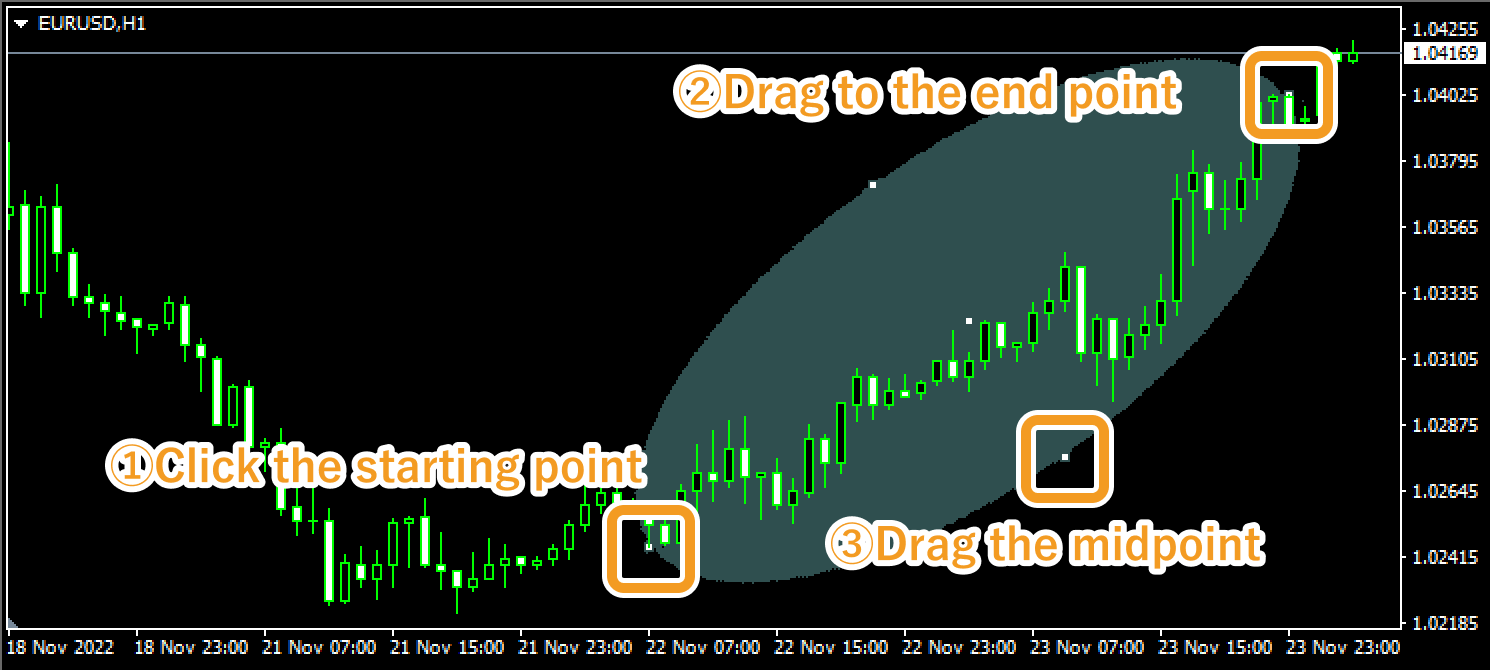
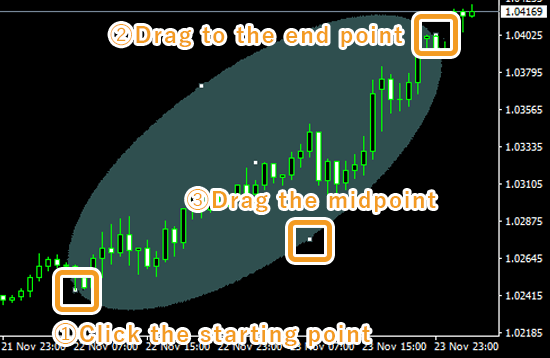
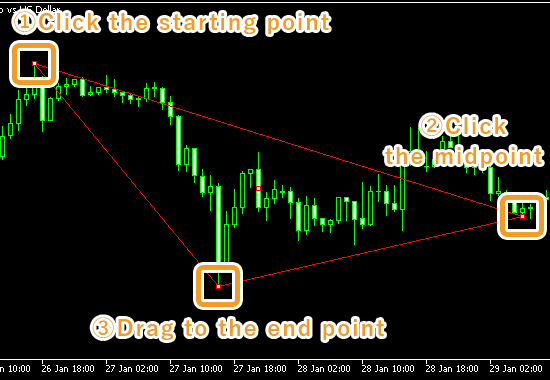
Click the starting point of the triangle on the chart. Click again at the midpoint, then drag the pointer to the end point to draw the triangle.
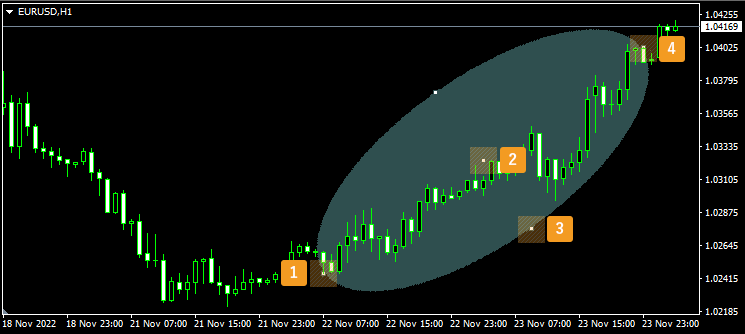
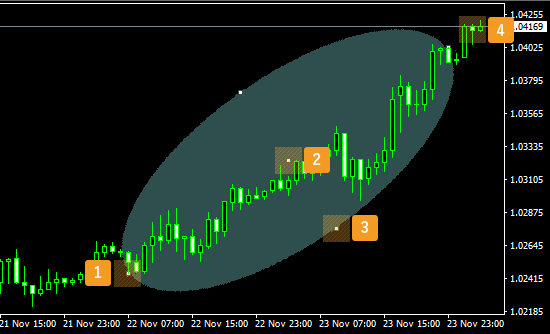
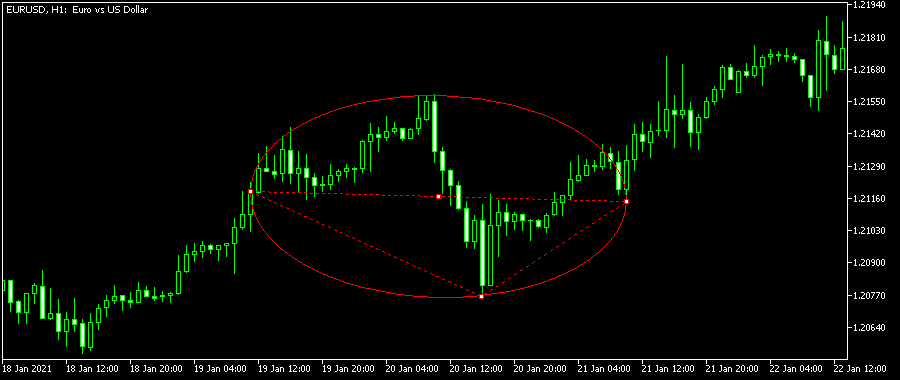
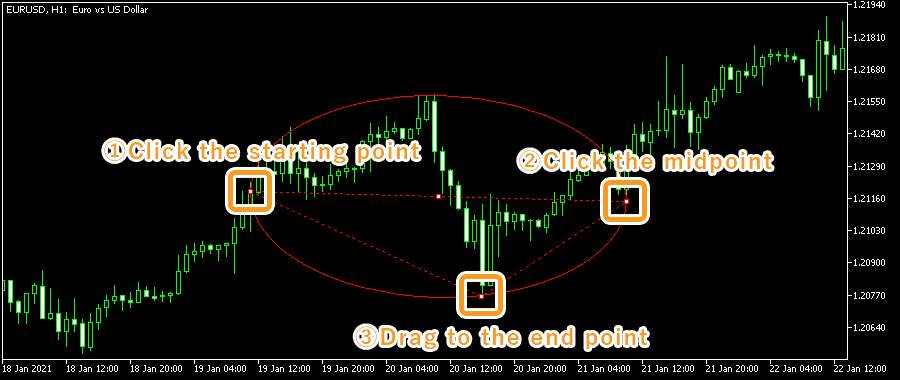
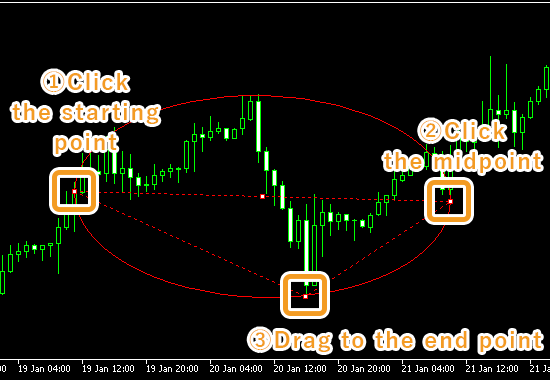
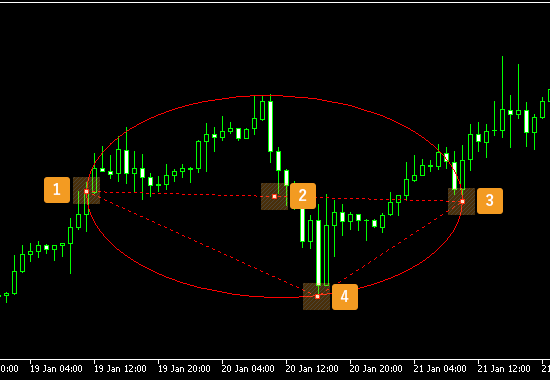
Click the starting point of the ellipse on the chart and drag it to the end point to plot the major axis. Then drag the white midpoint in the direction of the minor axis to create an ellipse. If you can't find the white point on the major axis, double-click around the area with a number in the image below.
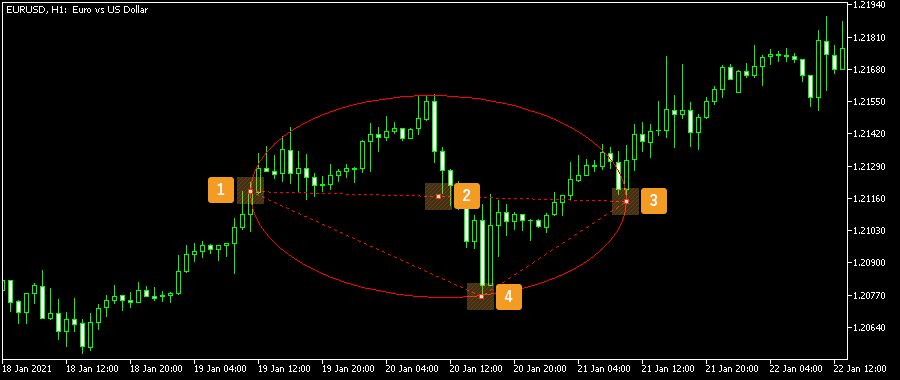
If you want to adjust the position of the shape, make sure the white dots are being displayed on the shape and move each dot as necessary. If you cannot see the white dots, double-click near the shape to display the white dots.
|
Number |
Descriptions |
|---|---|
|
1 |
Change the starting point of the shape. |
|
2 |
Change the position of the shape. |
|
3 |
Change the midpoint of the shape. |
|
4 |
Change the end point of the shape. |
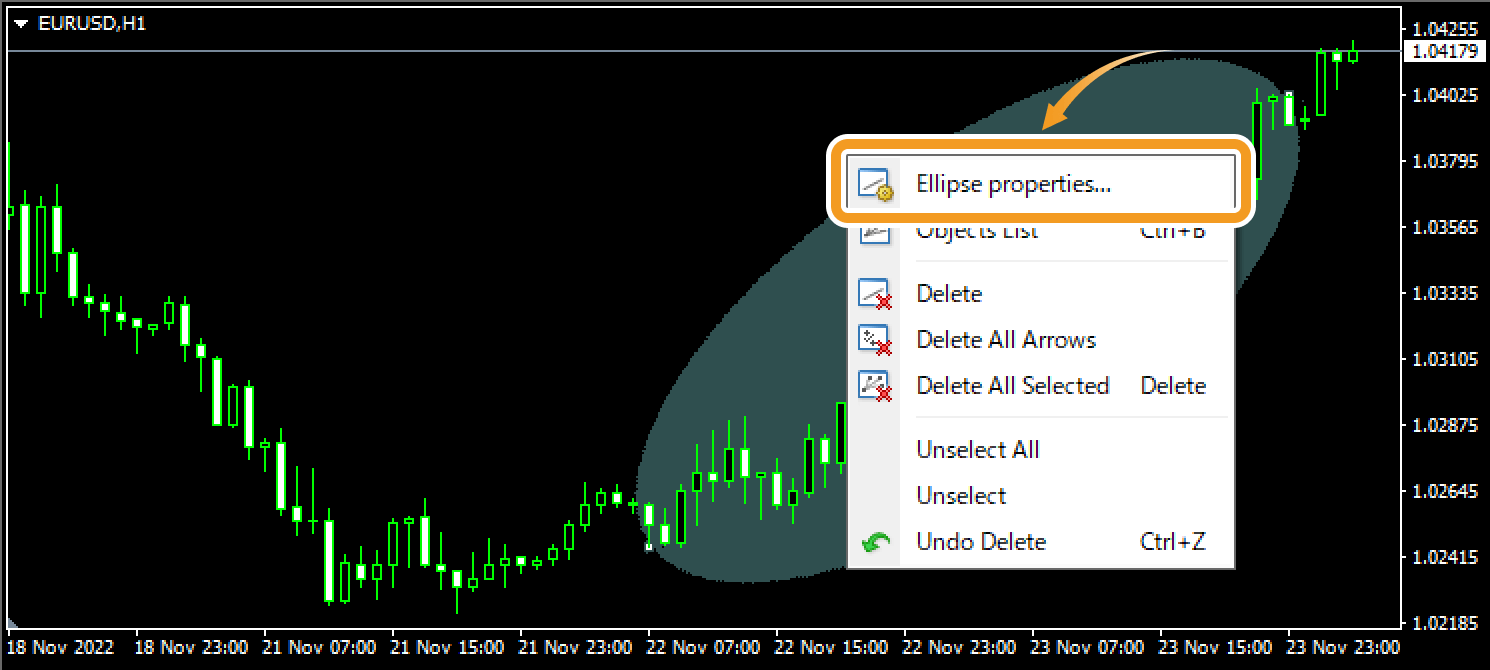
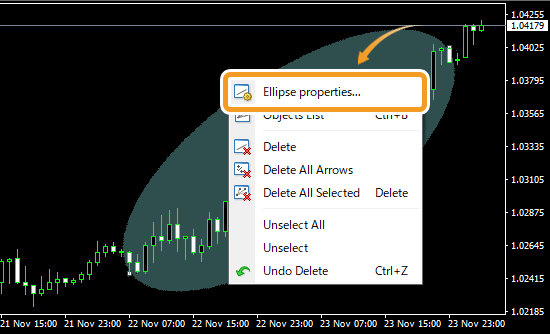
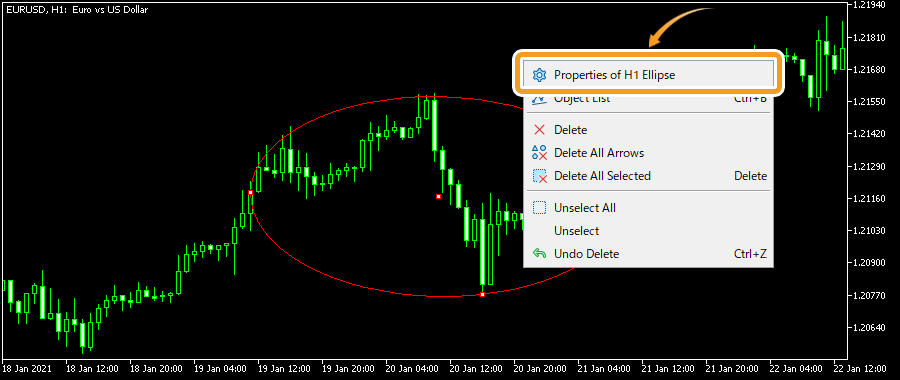
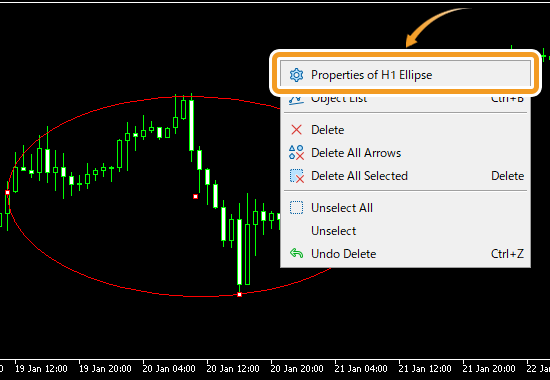
To modify the shape settings, right-click near the white point and select "(shape name) properties".
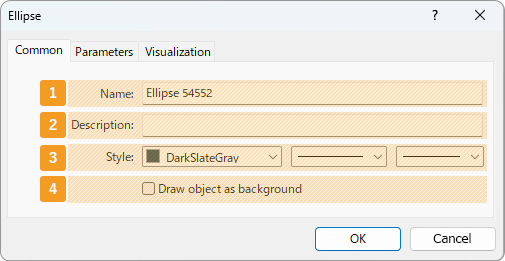
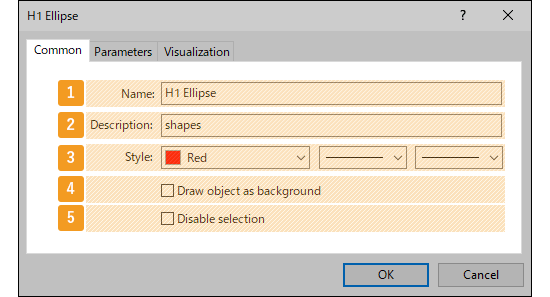
On the "Properties" window, edit the parameters in the "Common", "Parameters", and "Visualization" tabs and click "OK".
|
Number |
Item name |
Descriptions |
|---|---|---|
|
1 |
Name |
Name the shape. |
|
2 |
Description |
The description of the shape can be displayed on the chart. |
|
3 |
Style |
Set the color, line type, and line thickness for the shape. |
|
4 |
Draw object as background |
Check this box if you want to place the shape behind the chart. |
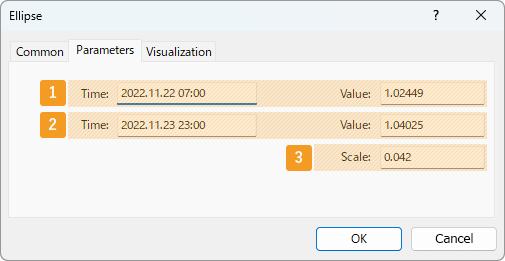
|
Number |
Item name |
Descriptions |
|---|---|---|
|
1 |
Starting point position |
Specify the starting point position by date, time, and price. |
|
2 |
End point position |
Specify the end point position by date, time, and price. For triangles, specify the midpoint position instead. |
|
3 |
Scale |
Change the length of the ellipse's minor axis. The smaller the value, the longer the minor axis. This parameter is not available for rectangles. For triangles, this parameter is to specify the end point position by date, time, and price. |
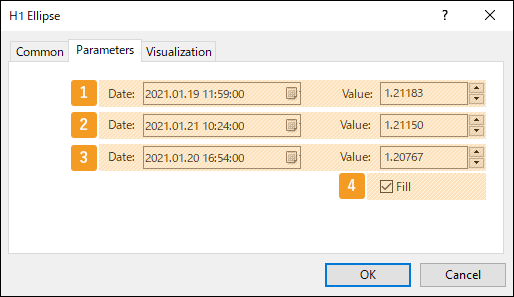
On MT5, you can choose whether to fill a shape with color or only show the border.
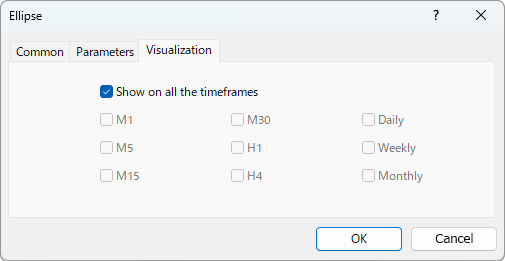
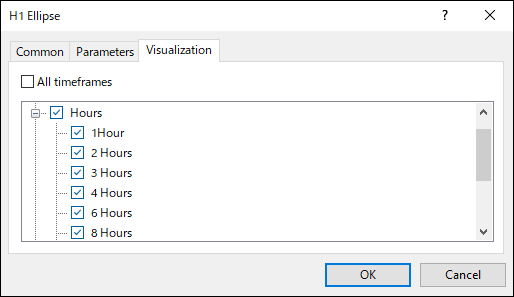
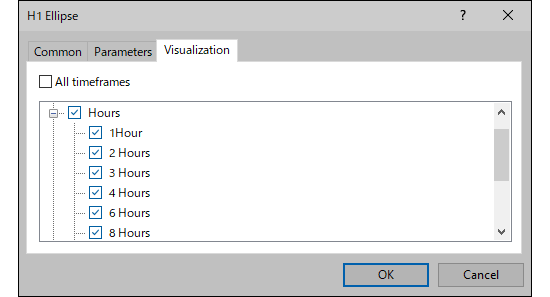
On the "Visualization" tab, you can specify the timeframes to use the shape with.
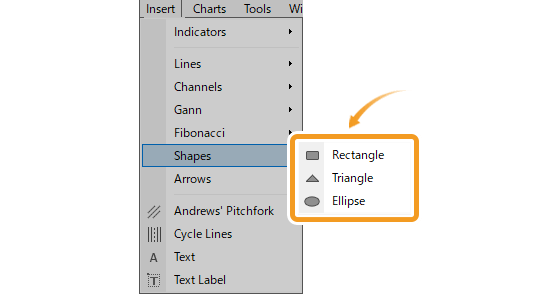
Click "Insert" in the menu. Hover the pointer over "Objects" > "Shapes" and select a shape.
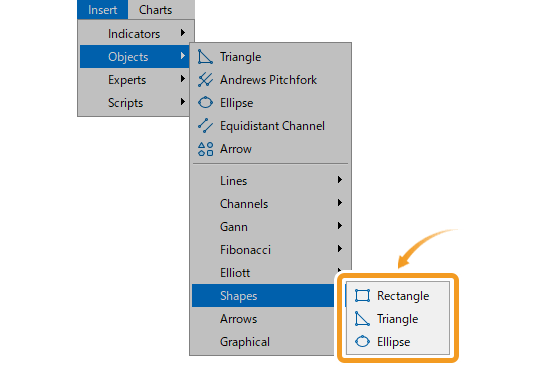
Rectangle
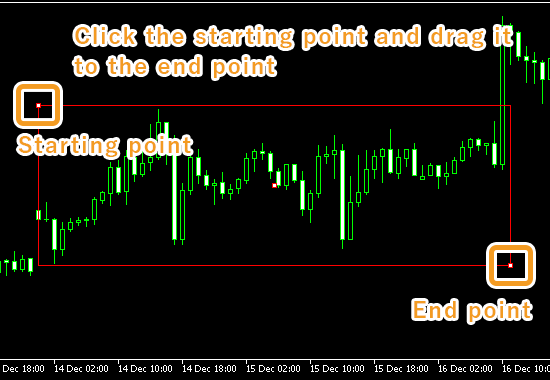
Highlight a specific part of the chart with a rectangle.
Triangle

Highlight a specific part of the chart with a triangle.
Ellipse

Highlight a specific part of the chart with an ellipse.
The methods for drawing vary by shape. Here, we'll cover how to draw a rectangle, triangle, and ellipse.
Click the starting point on the chart and drag it to the end point to create a rectangle.
Click the starting point of the triangle on the chart. Click again at the midpoint, then drag the pointer to the end point to draw the triangle.
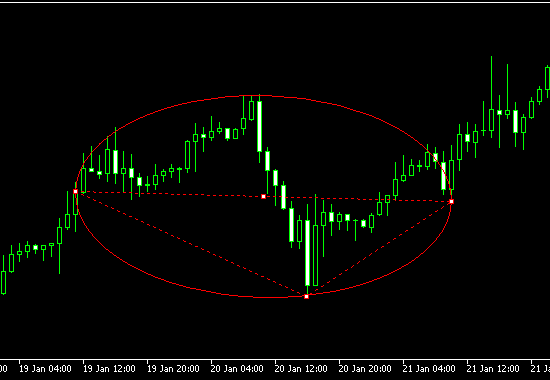
Click the starting point of the ellipse on the chart and drag it to the end point to plot the major axis. Then drag the white midpoint in the direction of the minor axis to create an ellipse. If you can't find the white point on the major axis, double-click around the area with a number in the image below.
If you want to adjust the position of the shape, make sure the white dots are being displayed on the shape and move each dot as necessary. If you cannot see the white dots, double-click near the shape to display the white dots.
|
Number |
Descriptions |
|---|---|
|
1 |
Change the starting point of the shape. |
|
2 |
Change the position of the shape. |
|
3 |
Change the midpoint of the shape. |
|
4 |
Change the end point of the shape. |
To modify the shape settings, right-click near the white point and select "Properties of (shape name)".
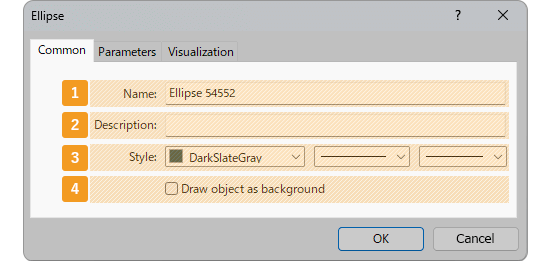
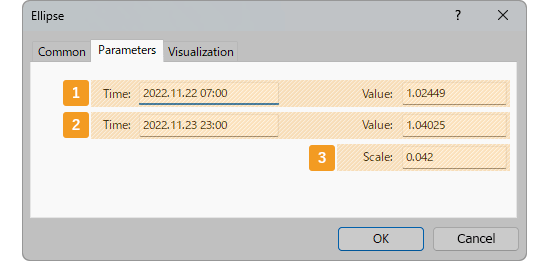
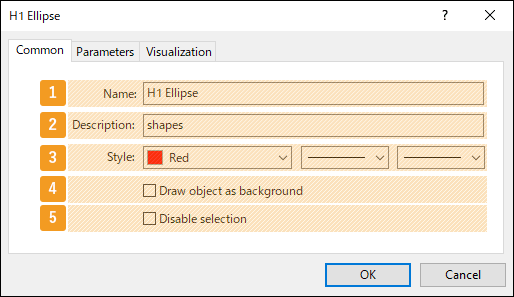
On the "Properties" window, edit the parameters in the "Common", "Parameters", and "Visualization" tabs and click "OK".
|
Number |
Item name |
Descriptions |
|---|---|---|
|
1 |
Name |
Name the shape. |
|
2 |
Description |
The description of the shape can be displayed on the chart.
|
|
3 |
Style |
Set the color, line type, and line thickness for the shape. |
|
4 |
Draw object as background |
Check this box if you want to place the shape behind the chart. |
|
5 |
Disable selection |
Check this box if you want to disable the editing of the shape. |
|
Number |
Item name |
Descriptions |
|---|---|---|
|
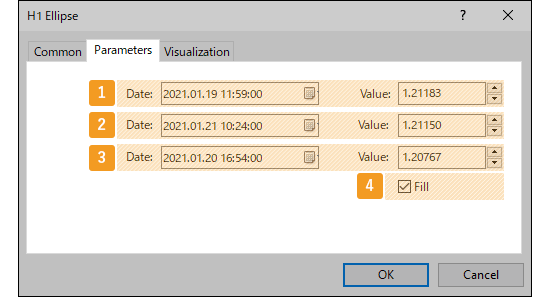
1 |
Starting point position |
Specify the starting point position by date, time, and price. |
|
2 |
Midpoint position |
Specify the midpoint position by date, time, and price. |
|
3 |
End point position |
Specify the end point position by date, time, and price. |
|
4 |
Fill |
Check this box to fill inside the shape. |
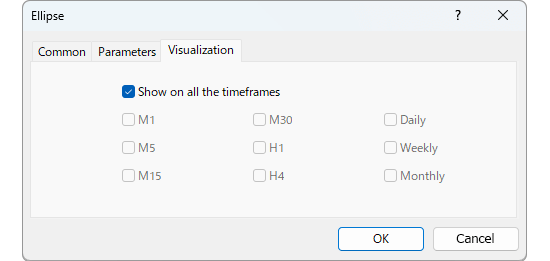
On the "Visualization" tab, you can specify the timeframes to use the shape with.
![]()
Created
: 2022.09.13
![]()
Last updated
: 2026.03.24

Nakamaru is a manual production consultant at FINTECS, a company that specializes in creating manuals for their clients.
With a wide range of experience from fintech to entertainment, he presents what user-friendly manuals should be like.
He works with numerous large corporations as an external manual production project manager.
【Business information】
http://www.fintecs.co.jp/profile/
Akira Takagi
Systems engineer, MetaTrader administrator

After graduating from Computer Science at the Uninove, Brazil, in 2014, he has worked on various systems development projects.
He participated as a developer in the launch of forex services in 2019. Since then, he has also been involved in the development of MetaTrader plugins and APIs. He is certified by MetaQuotes as a MetaTrader5 Administrator and active in consulting and advisory as well.
We hope you find this article useful. Any comments or suggestions will be greatly appreciated.
We are also looking for writers with extensive experience in forex and crypto to join us.
please contact us at [email protected].

MT4/MT5: Modify EA/indicator settings
![]() 2025.11.05
2025.11.05
![]() 2026.06.19
2026.06.19
On MetaTrader 4 (MT4) / MetaTrader 5 (MT5), you can customize the settings of Expert Advisors (EAs) and indicators applied to charts, supporting your trading strategy or visual preferences.

MT4/MT5: Create or load EA/indicator settings file
![]() 2025.10.06
2025.10.06
![]() 2026.06.19
2026.06.19
In MetaTrader 4 (MT4) and MetaTrader 5 (MT5), you can create or load a settings file to save and reuse your customized parameters. This helps save time each time you apply EAs and indicators to a chart.

MT4/MT5: Install custom indicator
![]() 2023.03.17
2023.03.17
![]() 2026.03.18
2026.03.18
On MT4/MT5, you can install indicators of your choice aside from the pre-installed technical indicators. The indicators installed by users are called custom indicators.

MT4/MT5: Backtest Expert Advisor (EA)
![]() 2022.10.28
2022.10.28
![]() 2026.03.18
2026.03.18
You can perform backtests on automated trading programs known as Expert Advisor (EA) using MT4/MT5's Strategy Tester feature. Here we will look at how to perform Expert Advisor (EA) backtests on MT4/MT5.

MT4/MT5: Save Expert Advisor (EA) testing report
![]() 2022.10.28
2022.10.28
![]() 2026.03.24
2026.03.24
Here we will look at how to save an Expert Advisor (EA) testing report on MT4/MT5. With MT4/MT5's Strategy Tester feature, you can save a result of the Expert Advisor (EA) backtest.
MT4/MT5: Install Expert Advisor (EA)
![]() 2022.10.19
2022.10.19
![]() 2026.03.25
2026.03.25
To use a third-party Expert Advisor (EA), you must first install it on MT4/MT5. Save the Expert Advisor (EA) files to the "Experts" folder of MT4/MT5, and restart MT4/MT5 to complete the installation.
Disclaimer:![]()
All information and content provided on this website is provided for informational purposes only and is not intended to solicit any investment. Although all efforts are made in order to ensure that the information is correct, no guarantee is provided for the accuracy of any content on this website. Any decision made shall be the responsibility of the investor and Myforex does not take any responsibility whatsoever regarding the use of any information provided herein.
The copyright in our content belongs to us.
We welcome your use of our content within appropriate limits, including use through our sharing features, sharing on social media, and quotation. However, please refrain from unauthorized reuse, including but not limited to commercial use, reproduction with modification of content, or reproduction on websites that compete with us. We may take necessary measures, including but not limited to deletion of the relevant content, if we consider that the content has been used in an inappropriate or unauthorized manner.
Myforex uses cookies to improve the convenience and functionality of this website. This website may include cookies not only by us but also by third parties (advertisers, log analysts, etc.) for the purpose of tracking the activities of users. Cookie policy
