


Created
: 2022.08.25


On MetaTrader4 (MT4) / MetaTrader5 (MT5), you can display the On-balance volume (OBV), a technical indicator developed by Joseph Granville (USA).
Since it relies on volume for its calculations, it is best suited for symbols with available volume data, such as stocks. While OBV is less commonly used for forex symbols due to the lack of volume data, you can substitute tick volume, which represents the number of ticks.
Here we will look at how to add OBV to a chart on MT4/MT5.
Switch between MT4/MT5 tabs to check the steps for each.
OBV can be set up from the menu or the Navigator.
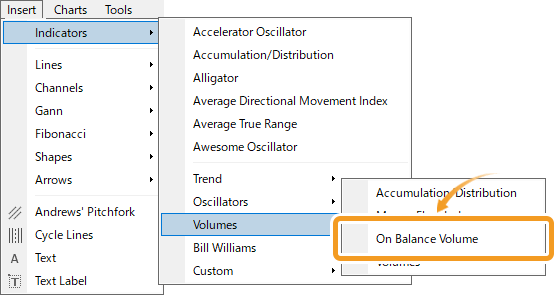
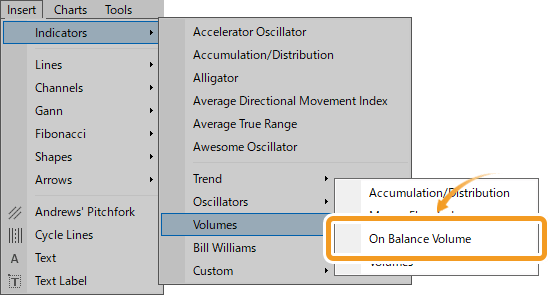
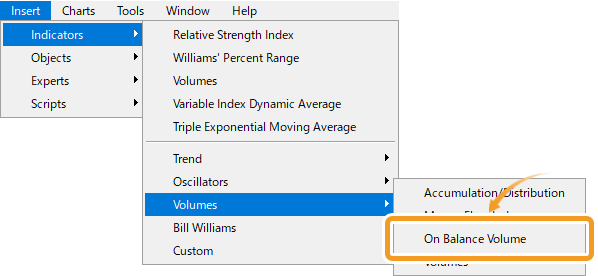
Click "Insert" in the menu. Hover the pointer over "Indicators" > "Volumes" and select "On Balance Volume".
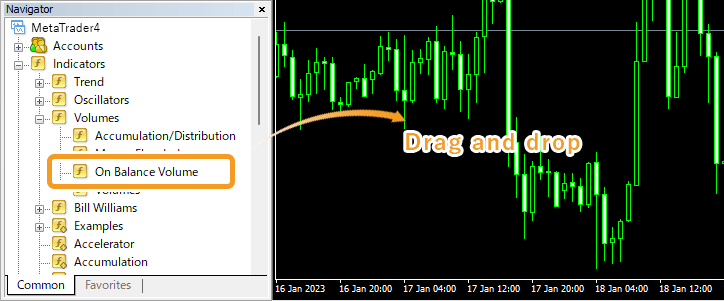
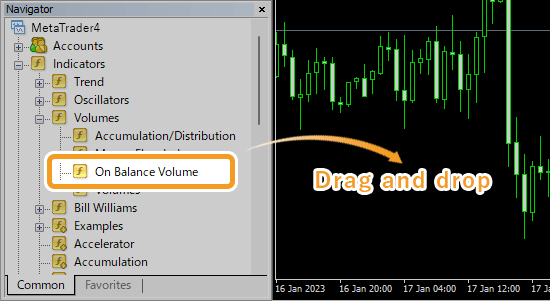
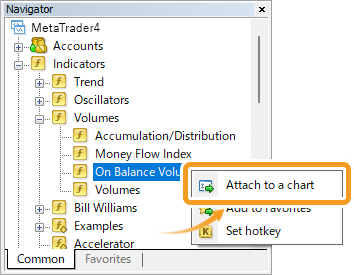
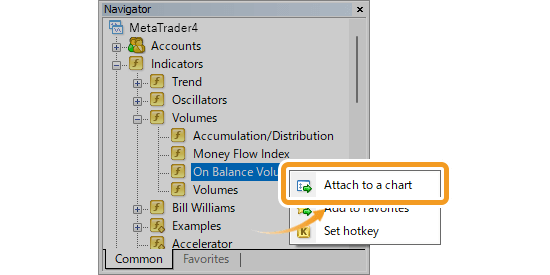
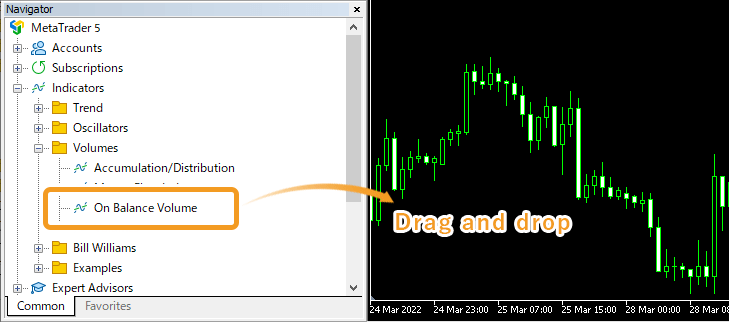
On the Navigator, click on the "+" signs next to "Indicators" and "Volumes". Select "On Balance Volume" and drag it onto the chart you wish to apply it to.
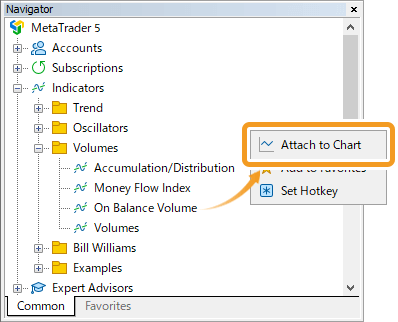
Or, right-click on "On Balance Volume" and select "Attach to a Chart".
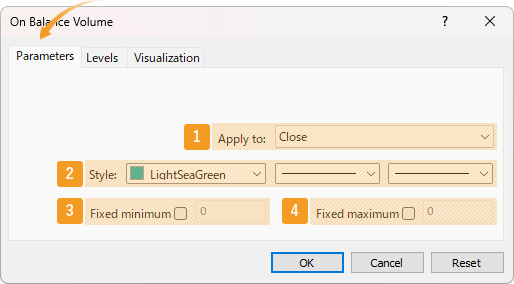
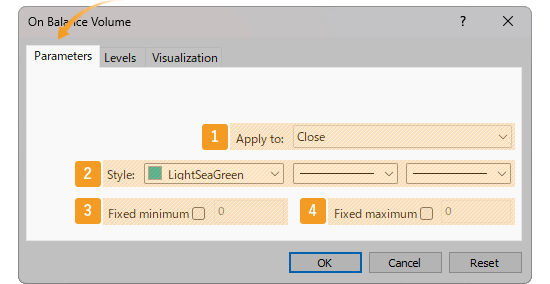
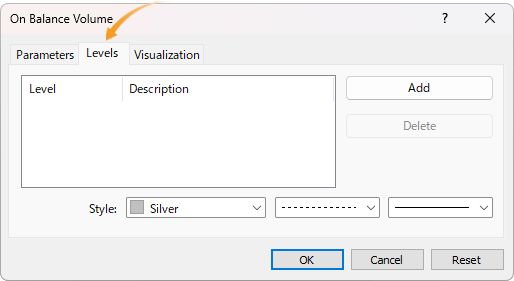
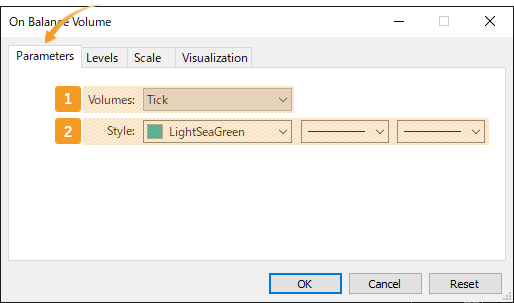
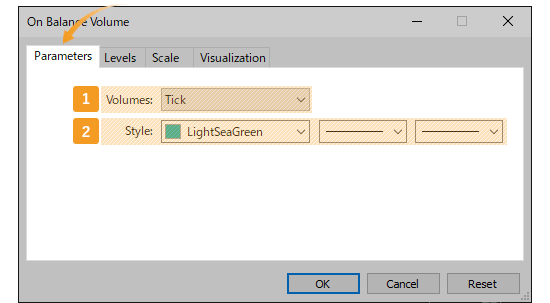
The setting window for OBV will appear. Set the parameters in the "Parameters", "Levels", and "Visualization" tabs and click "OK".
|
Number |
Item name |
Descriptions |
|---|---|---|
|
1 |
Apply to |
Price to use for calculating OBV. Close: close price Open: open price High: high price Low: low price Median Price (HL/2): (high price + low price) ÷2 Typical Price (HLC/3): (high price + low price + close price) ÷3 Weighted Close (HLCC/4): (high price + low price + close price×2) ÷4 |
|
2 |
Style |
Set the color, line type, and line thickness for OBV. |
|
3 |
Fixed minimum |
Set the minimum value for OBV on the sub-window. |
|
4 |
Fixed maximum |
Set the maximum value for OBV on the sub-window. |
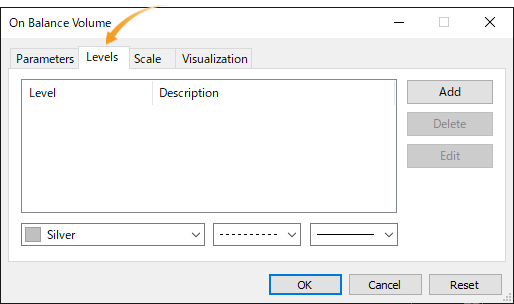
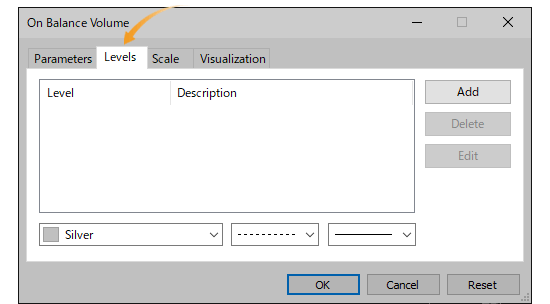
In the OBV sub-window, you can display horizontal lines at the specified levels. If you want to add a horizontal line, click "Add" and enter the number.
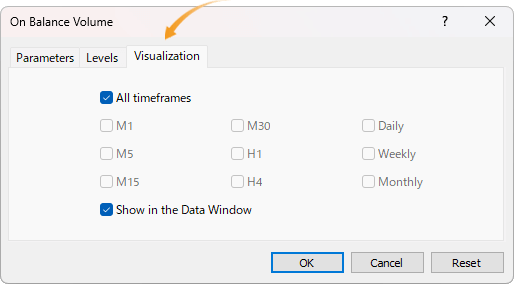
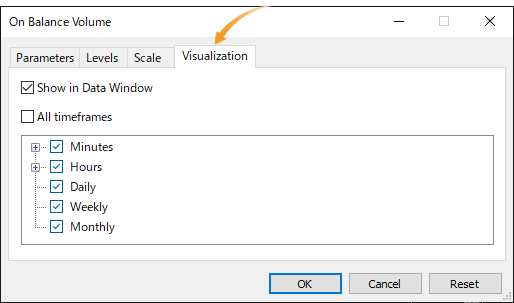
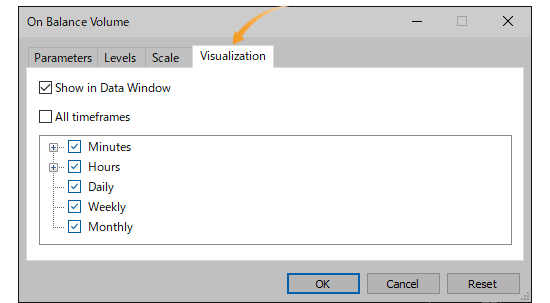
In the "Visualization" tab, you can set the timeframes to display OBV. As OBV can only be displayed in a sub-window, it will be displayed in the sub-window even if "Show in the Data Window" is unchecked.
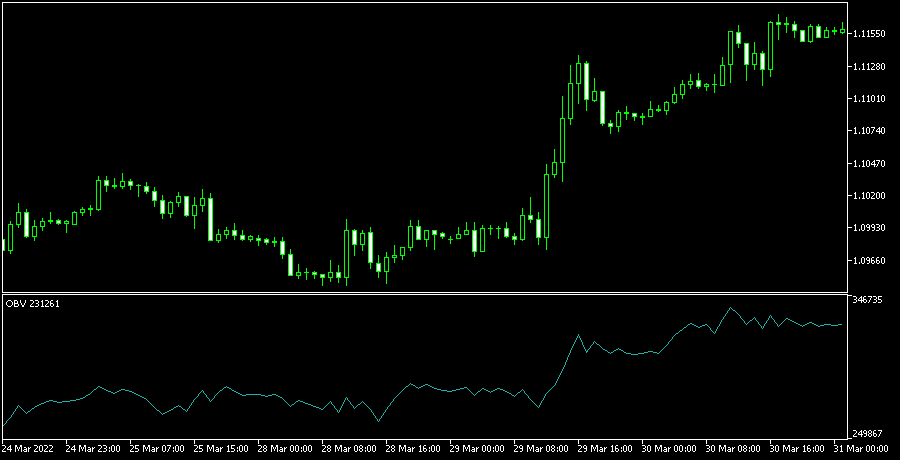
OBV will be displayed on the sub-window of chart.
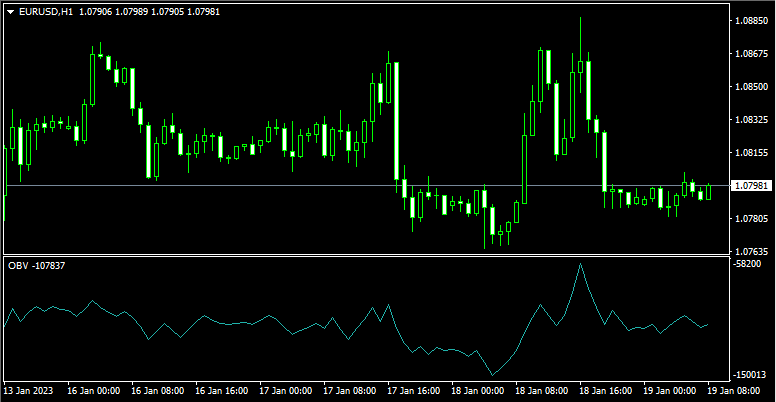
In general, indicators can be grouped into two categories: trend and oscillator indicators. These indicators are designed to focus on price fluctuations. On the other hand, OBV looks at volume in addition to price fluctuations. Like OBV, indicators that focus on volume are classified as volume-based.
OBV can be set up from the menu or the Navigator.
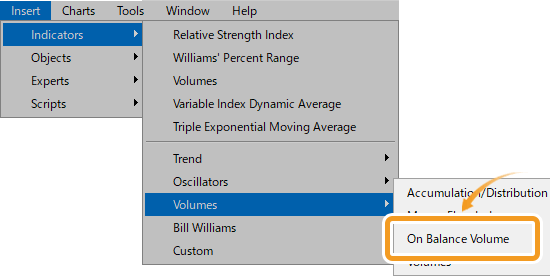
Click "Insert" in the menu. Hover the pointer over "Indicators" > "Volumes" and select "On Balance Volume".
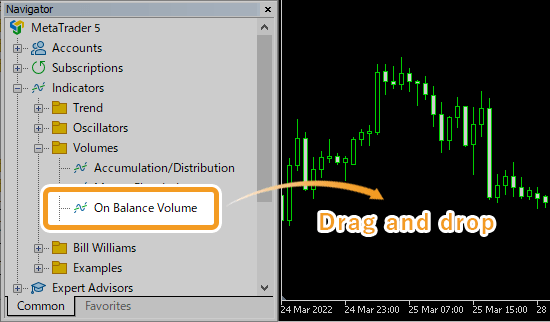
On the Navigator, go to "Indicators" and click on the "+" sign next to "Volumes". Select "On Balance Volume" and drag it onto the chart you wish to apply it to.
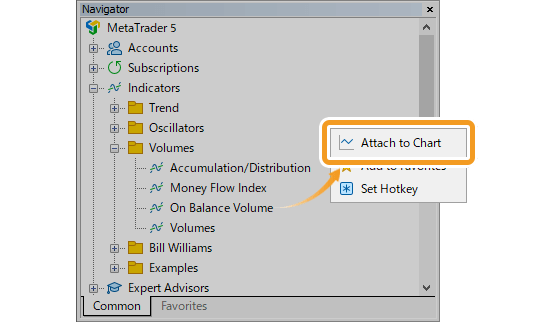
Or, right-click on "On Balance Volume" and select "Attach to Chart".
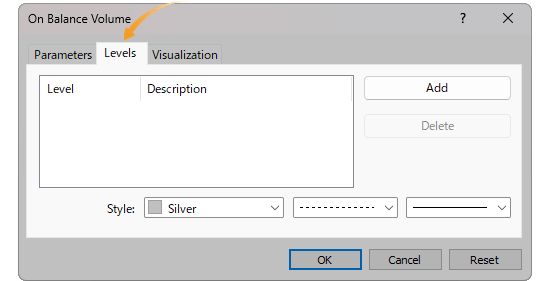
The setting window for OBV will appear. Set the parameters in the "Parameters", "Levels", "Scale", and "Visualization" tab and click "OK".
|
Number |
Item name |
Descriptions |
|---|---|---|
|
1 |
Volume |
Specify the data to use for OBV. Volume for forex and CFD symbols not traded in the exchange cannot be calculated, in which case, the system will use the tick volume instead of volume.
|
|
2 |
Style |
Set the color, line type, and line thickness for OBV. |
In the OBV sub-window, you can display horizontal lines at the specified levels. If you want to add a horizontal line, click "Add" and enter the number.
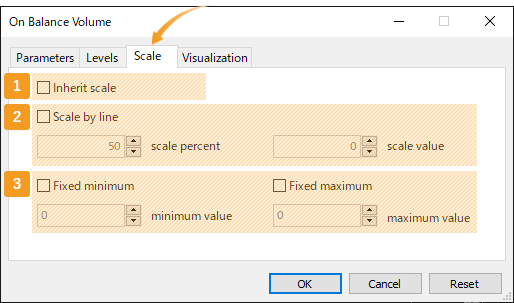
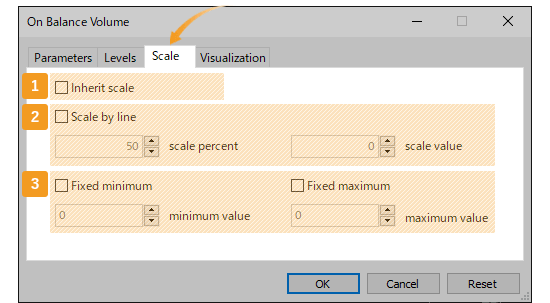
Set the scale of the sub-window for OBV.
|
Number |
Item name |
Descriptions |
|---|---|---|
|
1 |
Inherit scale |
Check this box if you want to inherit the scale of the previous indicator when displaying multiple indicators on the same sub-window. |
|
2 |
Scale by line |
Specify where you want the OBV to show up on the sub-window. If you set the scale percentage to "50" and the scale value to "0", the scale of the vertical axis will be adjusted so that the scale value of "0" will be set at the 50% mark (max value is 100%). |
|
3 |
Fixed minimum/maximum |
Set the minimum/maximum values for OBV on the sub-window. |
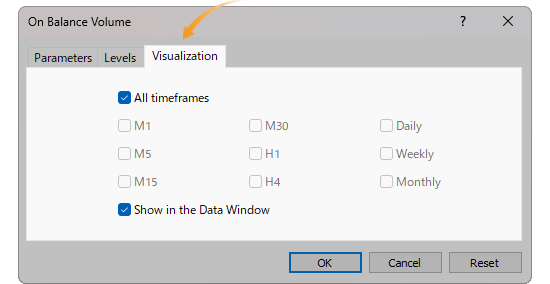
In the "Visualization" tab, you can set the timeframes to display OBV. As OBV can only be displayed in a sub-window, it will still be displayed in the sub-window even if "Show in Data Window" is unchecked.
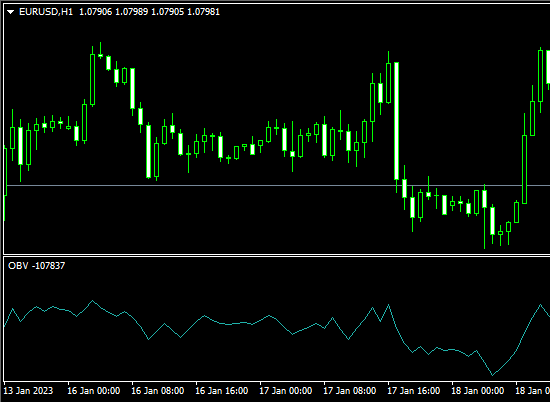
OBV will be displayed on the sub-window of chart.
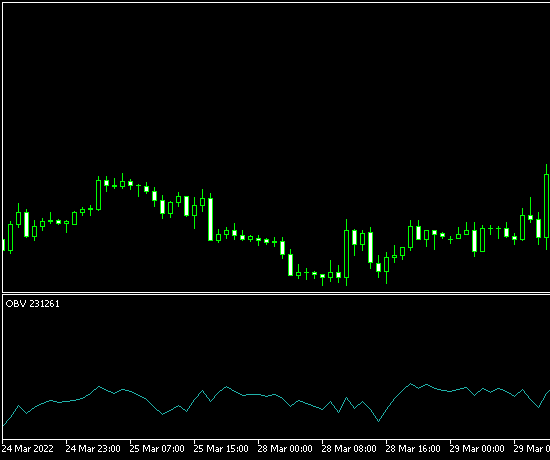
In general, indicators can be grouped into two categories: trend and oscillator indicators. These indicators are designed to focus on price fluctuations. On the other hand, OBV looks at volume in addition to price fluctuations. Like OBV, indicators that focus on volume are classified as volume-based.
![]()
Created
: 2022.08.25
![]()
Last updated
: 2026.03.26

Nakamaru is a manual production consultant at FINTECS, a company that specializes in creating manuals for their clients.
With a wide range of experience from fintech to entertainment, he presents what user-friendly manuals should be like.
He works with numerous large corporations as an external manual production project manager.
【Business information】
http://www.fintecs.co.jp/profile/
Akira Takagi
Systems engineer, MetaTrader administrator

After graduating from Computer Science at the Uninove, Brazil, in 2014, he has worked on various systems development projects.
He participated as a developer in the launch of forex services in 2019. Since then, he has also been involved in the development of MetaTrader plugins and APIs. He is certified by MetaQuotes as a MetaTrader5 Administrator and active in consulting and advisory as well.
We hope you find this article useful. Any comments or suggestions will be greatly appreciated.
We are also looking for writers with extensive experience in forex and crypto to join us.
please contact us at [email protected].

MT4/MT5: Modify EA/indicator settings
![]() 2025.11.05
2025.11.05
![]() 2026.06.19
2026.06.19
On MetaTrader 4 (MT4) / MetaTrader 5 (MT5), you can customize the settings of Expert Advisors (EAs) and indicators applied to charts, supporting your trading strategy or visual preferences.

MT4/MT5: Create or load EA/indicator settings file
![]() 2025.10.06
2025.10.06
![]() 2026.06.19
2026.06.19
In MetaTrader 4 (MT4) and MetaTrader 5 (MT5), you can create or load a settings file to save and reuse your customized parameters. This helps save time each time you apply EAs and indicators to a chart.

MT4/MT5: Install custom indicator
![]() 2023.03.17
2023.03.17
![]() 2026.03.18
2026.03.18
On MT4/MT5, you can install indicators of your choice aside from the pre-installed technical indicators. The indicators installed by users are called custom indicators.

MT4/MT5: Backtest Expert Advisor (EA)
![]() 2022.10.28
2022.10.28
![]() 2026.03.18
2026.03.18
You can perform backtests on automated trading programs known as Expert Advisor (EA) using MT4/MT5's Strategy Tester feature. Here we will look at how to perform Expert Advisor (EA) backtests on MT4/MT5.

MT4/MT5: Save Expert Advisor (EA) testing report
![]() 2022.10.28
2022.10.28
![]() 2026.03.24
2026.03.24
Here we will look at how to save an Expert Advisor (EA) testing report on MT4/MT5. With MT4/MT5's Strategy Tester feature, you can save a result of the Expert Advisor (EA) backtest.
MT4/MT5: Install Expert Advisor (EA)
![]() 2022.10.19
2022.10.19
![]() 2026.03.25
2026.03.25
To use a third-party Expert Advisor (EA), you must first install it on MT4/MT5. Save the Expert Advisor (EA) files to the "Experts" folder of MT4/MT5, and restart MT4/MT5 to complete the installation.
Disclaimer:![]()
All information and content provided on this website is provided for informational purposes only and is not intended to solicit any investment. Although all efforts are made in order to ensure that the information is correct, no guarantee is provided for the accuracy of any content on this website. Any decision made shall be the responsibility of the investor and Myforex does not take any responsibility whatsoever regarding the use of any information provided herein.
The copyright in our content belongs to us.
We welcome your use of our content within appropriate limits, including use through our sharing features, sharing on social media, and quotation. However, please refrain from unauthorized reuse, including but not limited to commercial use, reproduction with modification of content, or reproduction on websites that compete with us. We may take necessary measures, including but not limited to deletion of the relevant content, if we consider that the content has been used in an inappropriate or unauthorized manner.
Myforex uses cookies to improve the convenience and functionality of this website. This website may include cookies not only by us but also by third parties (advertisers, log analysts, etc.) for the purpose of tracking the activities of users. Cookie policy
