


Created
: 2022.07.19


In MetaTrader 4 (MT4) and MetaTrader 5 (MT5), you can display the Moving Average (MA), one of the most commonly used technical indicators. There are several types of MAs, including the Simple Moving Average (SMA), as wel as the Exponential Moving Average (EMA), which places more emphasis on recent prices.
Here we will look at how to add MA to charts on MT4/MT5.
Switch between MT4/MT5 tabs to check the steps for each.
You can add MA from the menu and the Navigator.
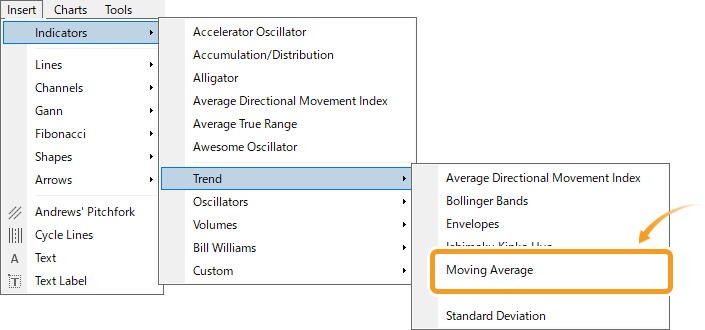
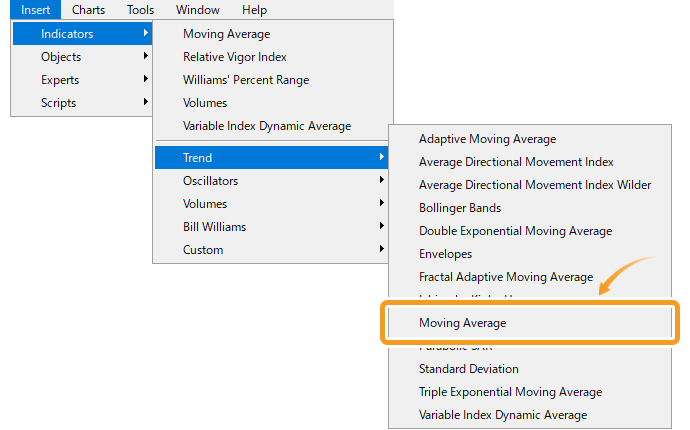
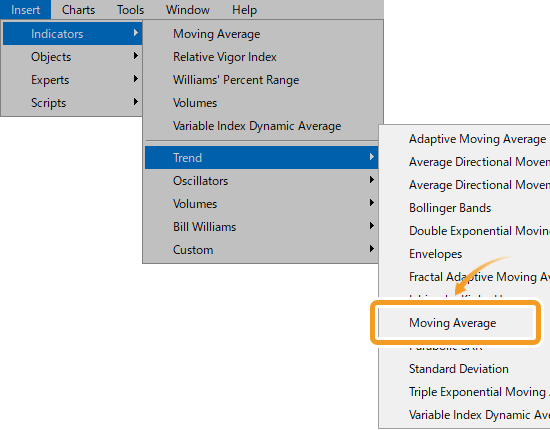
Click "Insert" in the menu. Hover the pointer over "Indicators" > "Trend" and select "Moving Average".
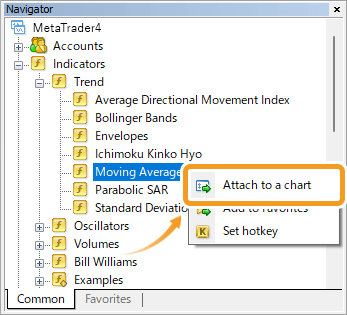
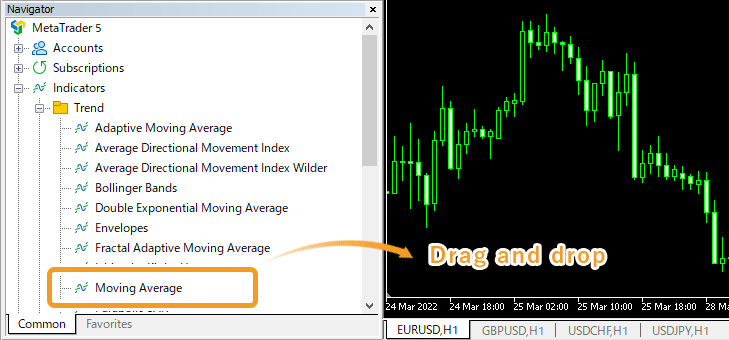
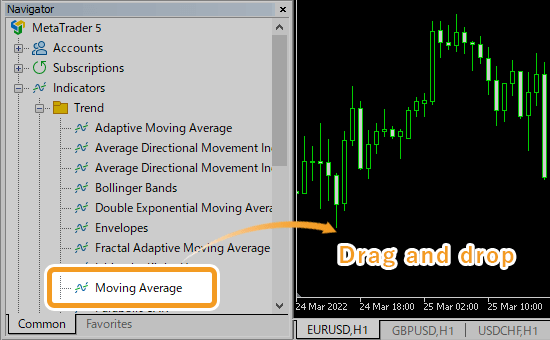
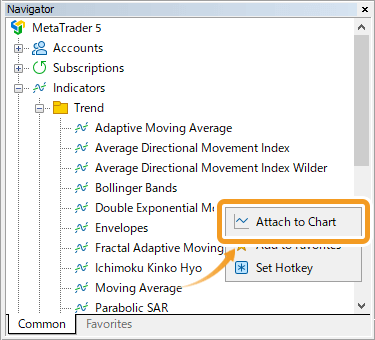
On the Navigator, click on the "+" sign next to "Indicators" and then "Trend". Select "Moving Average" and drag it onto the chart you wish to apply it to.
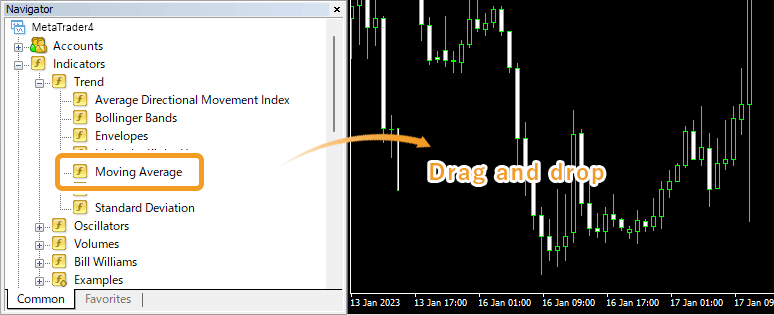
Or, right-click on "Moving Average" and select "Attach to a chart".
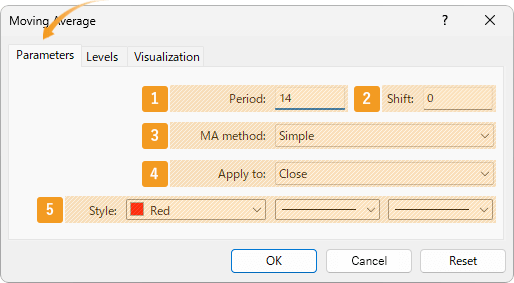
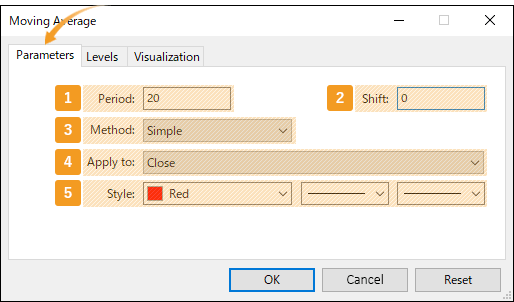
The setting window for MA will appear. Set the parameters in the "Parameters", "Levels", and "Visualization" tab and click "OK".
|
Number |
Item name |
Descriptions |
|---|---|---|
|
1 |
Period |
Set the period for the MA. The unit here is the number of candlesticks. If you select the daily chart and set it to "20", the MA for the past 20 days will be generated. |
|
2 |
Shift |
You can shift the placement of the MA to the left or right. The unit is the number of candles. Type a positive value to move it to the right, and a negative value to move it to the left. |
|
3 |
MA method |
Select the type of moving average to display. Simple: simple moving average (SMA) Exponential: exponential moving average (EMA) Smoothed: smoothed moving average (SMMA) Linear Weighted: linear weighted moving average (LWMA) |
|
4 |
Apply to |
Price to use for calculating MA. Close: close price Open: open price High: high price Low: low price Median Price (HL/2): (high price + low price) ÷2 Typical Price (HLC/3): (high price + low price + close price) ÷3 Weighted Close (HLCC/4): (high price + low price + close price×2) ÷4 Previous Indicator's Data: the value of the indicator displayed last First Indicator's Data: the value of the indicator displayed first |
|
5 |
Style |
Set the color, line type, and line thickness for MA. |
Granville, famous for "Granville's Law," categorized the correlations between price movements and the 200-day MA into 8 different patterns. This approach, which popularized the use of the 200-day MA on daily charts, laid the foundation for the widespread use of moving averages.
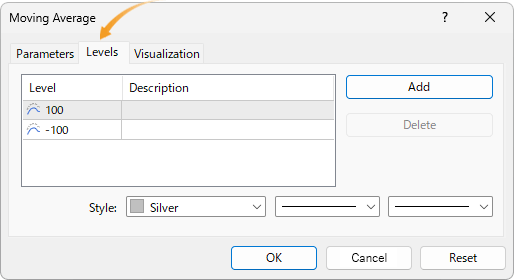
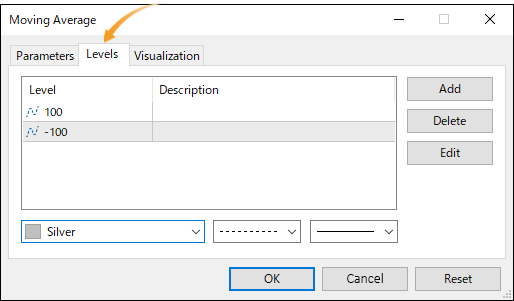
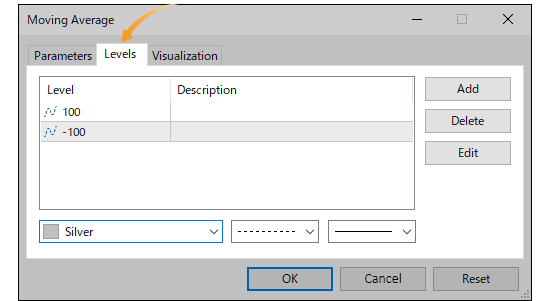
Go to the "Levels" tab and click "Add". Enter a positive number (unit: points) to show a new MA on top, and a negative number to show a new MA on the bottom of the current MA.
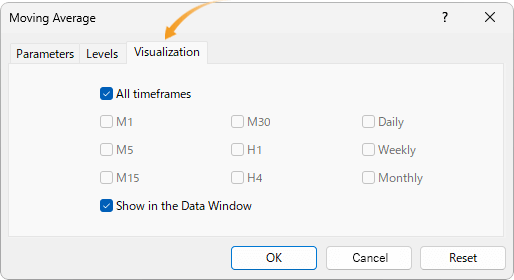
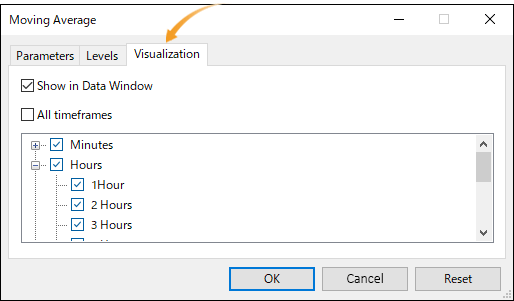
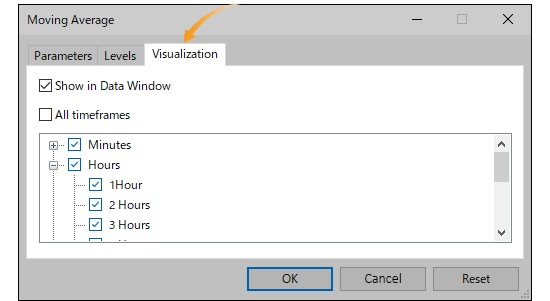
On the "Visualization" tab, you can show/hide MA in the Data Window and specify the timeframes to use MA with.
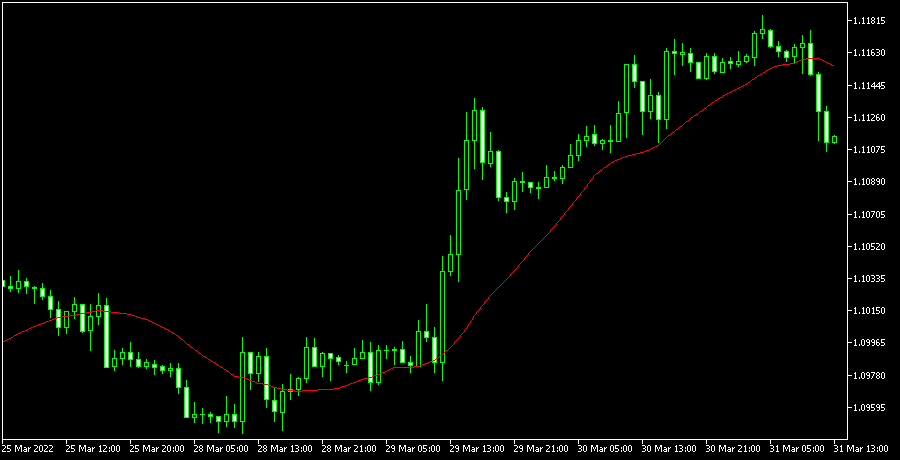
MA will be displayed on the chart.
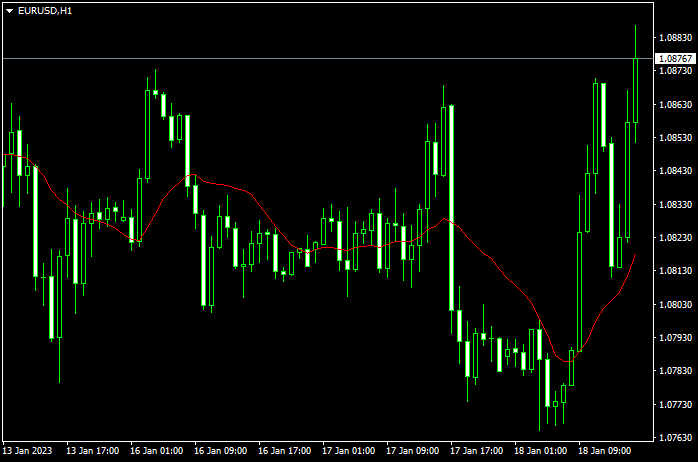
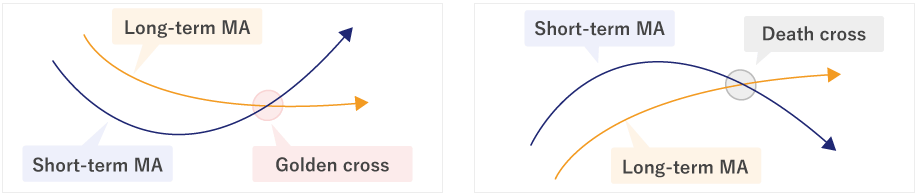
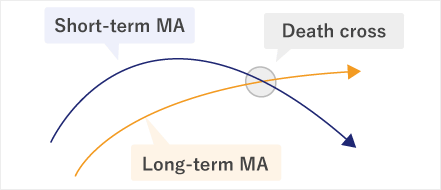
MA is classified into short/medium/long term and they're often used together. When the short-term MA crosses the long-term MA from the bottom up, it's called the "golden cross" which indicates a bull market. And when the short-term MA crosses the long-term MA from top to bottom, it's referred to as the "death cross", which indicates a bear market.

You can add MA from the menu and the Navigator.
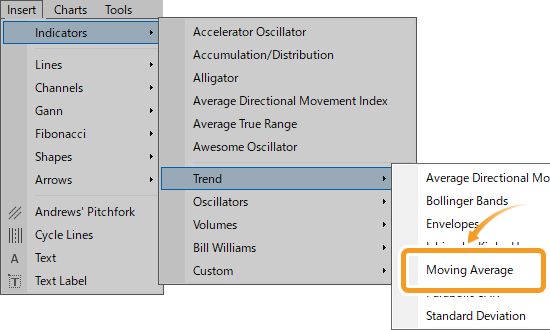
Click "Insert" in the menu. Hover the pointer over "Indicators" > "Trend" and select "Moving Average".
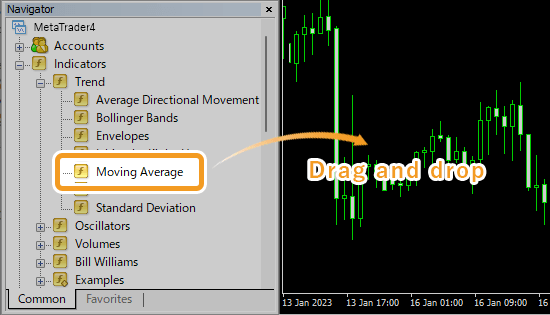
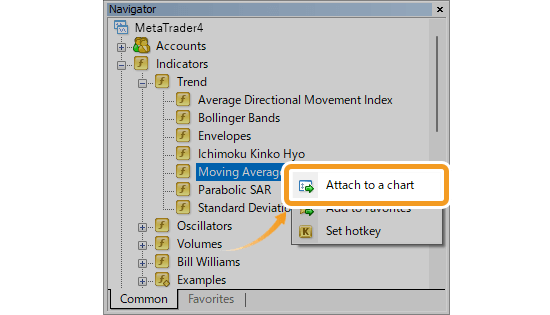
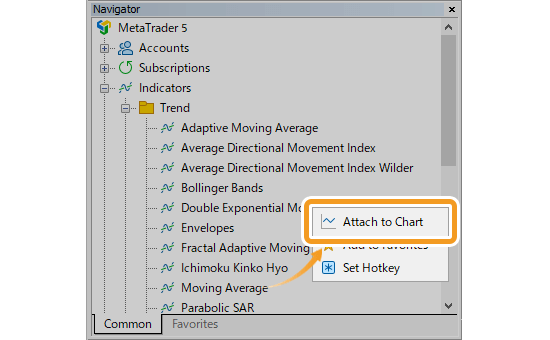
On the Navigator, go to "Indicators" and click on the "+" sign next to "Trend". Select "Moving Average" and drag it onto the chart you wish to apply it to.
Or, right-click on "Moving Average" and select "Attach to Chart".
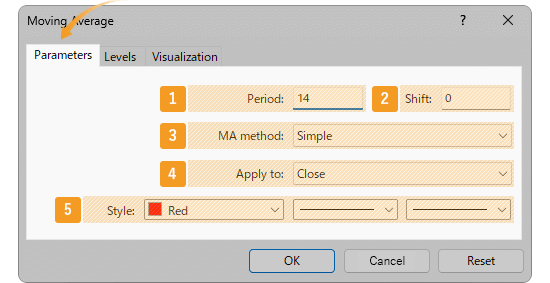
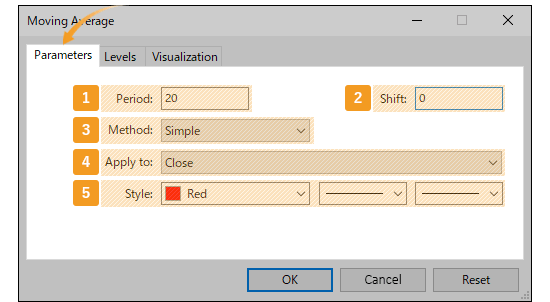
The setting window for MA will appear. Set the parameters in the "Parameters", "Levels", and "Visualization" tab and click "OK".
|
Number |
Item name |
Descriptions |
|---|---|---|
|
1 |
Period |
Set the period for the MA. The unit here is the number of candlesticks. If you select the daily chart and set it to "20", the MA for the past 20 days will be generated. |
|
2 |
Shift |
You can shift the placement of the MA to the left or right. The unit is the number of candles. Type a positive value to move it to the right, and a negative value to move it to the left. |
|
3 |
Method |
Select the type of moving average to display. Simple: simple moving average (SMA) Exponential: exponential moving average (EMA) Smoothed: smoothed moving average (SMMA) Linear Weighted: linear weighted moving average (LWMA) |
|
4 |
Apply to |
Price to use for calculating MA. Close: close price Open: open price High: high price Low: low price Median Price (HL/2): (high price + low price) ÷2 Typical Price (HLC/3): (high price + low price + close price) ÷3 Weighted Close (HLCC/4): (high price + low price + close price×2) ÷4 Previous Indicator's Data: the value of the indicator displayed last First Indicator's Data: the value of the indicator displayed first |
|
5 |
Style |
Set the color, line type, and line thickness for MA. |
Granville, famous for "Granville's Law," categorized the correlations between price movements and the 200-day MA into 8 different patterns. This approach, which popularized the use of the 200-day MA on daily charts, laid the foundation for the widespread use of moving averages.
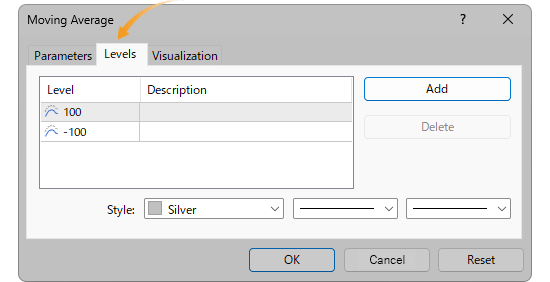
Go to the "Levels" tab and click "Add". Enter a positive number (unit: points) to show a new MA on top, and a negative number to show a new MA on the bottom of the current MA.
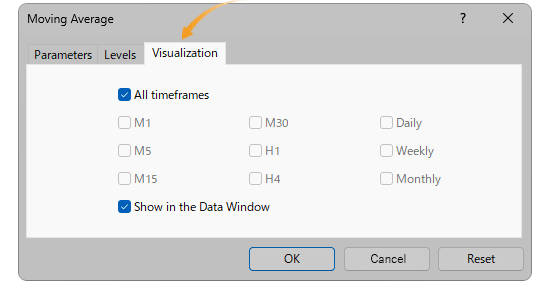
On the "Visualization" tab, you can show/hide MA in the Data Window and specify the timeframes to use MA with.
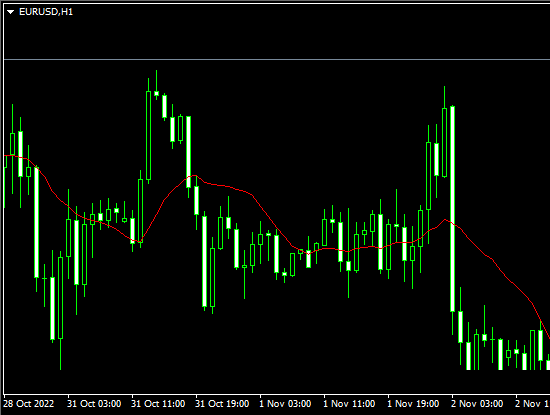
MA will be displayed on the chart.
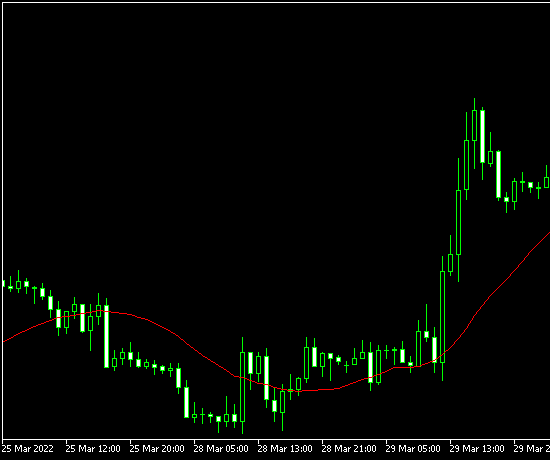
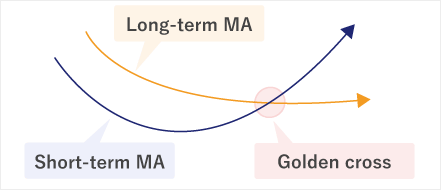
MA is classified into short/medium/long term and they're often used together. When the short-term MA crosses the long-term MA from the bottom up, it's called the "golden cross" which indicates a bull market. And when the short-term MA crosses the long-term MA from top to bottom, it's referred to as the "death cross", which indicates a bear market.


![]()
Created
: 2022.07.19
![]()
Last updated
: 2026.03.27

Nakamaru is a manual production consultant at FINTECS, a company that specializes in creating manuals for their clients.
With a wide range of experience from fintech to entertainment, he presents what user-friendly manuals should be like.
He works with numerous large corporations as an external manual production project manager.
【Business information】
http://www.fintecs.co.jp/profile/
Akira Takagi
Systems engineer, MetaTrader administrator

After graduating from Computer Science at the Uninove, Brazil, in 2014, he has worked on various systems development projects.
He participated as a developer in the launch of forex services in 2019. Since then, he has also been involved in the development of MetaTrader plugins and APIs. He is certified by MetaQuotes as a MetaTrader5 Administrator and active in consulting and advisory as well.
We hope you find this article useful. Any comments or suggestions will be greatly appreciated.
We are also looking for writers with extensive experience in forex and crypto to join us.
please contact us at [email protected].

MT4/MT5: Modify EA/indicator settings
![]() 2025.11.05
2025.11.05
![]() 2026.07.09
2026.07.09
On MetaTrader 4 (MT4) / MetaTrader 5 (MT5), you can customize the settings of Expert Advisors (EAs) and indicators applied to charts, supporting your trading strategy or visual preferences.

MT4/MT5: Create or load EA/indicator settings file
![]() 2025.10.06
2025.10.06
![]() 2026.07.09
2026.07.09
In MetaTrader 4 (MT4) and MetaTrader 5 (MT5), you can create or load a settings file to save and reuse your customized parameters. This helps save time each time you apply EAs and indicators to a chart.

MT4/MT5: Install custom indicator
![]() 2023.03.17
2023.03.17
![]() 2026.07.08
2026.07.08
On MT4/MT5, you can install indicators of your choice aside from the pre-installed technical indicators. The indicators installed by users are called custom indicators.

MT4/MT5: Backtest Expert Advisor (EA)
![]() 2022.10.28
2022.10.28
![]() 2026.07.05
2026.07.05
You can perform backtests on automated trading programs known as Expert Advisor (EA) using MT4/MT5's Strategy Tester feature. Here we will look at how to perform Expert Advisor (EA) backtests on MT4/MT5.

MT4/MT5: Save Expert Advisor (EA) testing report
![]() 2022.10.28
2022.10.28
![]() 2026.07.08
2026.07.08
Here we will look at how to save an Expert Advisor (EA) testing report on MT4/MT5. With MT4/MT5's Strategy Tester feature, you can save a result of the Expert Advisor (EA) backtest.
MT4/MT5: Install Expert Advisor (EA)
![]() 2022.10.19
2022.10.19
![]() 2026.07.09
2026.07.09
To use a third-party Expert Advisor (EA), you must first install it on MT4/MT5. Save the Expert Advisor (EA) files to the "Experts" folder of MT4/MT5, and restart MT4/MT5 to complete the installation.
Disclaimer:![]()
All information and content provided on this website is provided for informational purposes only and is not intended to solicit any investment. Although all efforts are made in order to ensure that the information is correct, no guarantee is provided for the accuracy of any content on this website. Any decision made shall be the responsibility of the investor and Myforex does not take any responsibility whatsoever regarding the use of any information provided herein.
The copyright in our content belongs to us.
We welcome your use of our content within appropriate limits, including use through our sharing features, sharing on social media, and quotation. However, please refrain from unauthorized reuse, including but not limited to commercial use, reproduction with modification of content, or reproduction on websites that compete with us. We may take necessary measures, including but not limited to deletion of the relevant content, if we consider that the content has been used in an inappropriate or unauthorized manner.
Myforex uses cookies to improve the convenience and functionality of this website. This website may include cookies not only by us but also by third parties (advertisers, log analysts, etc.) for the purpose of tracking the activities of users. Cookie policy
