Created
: 2022.07.27


On MetaTrader4 (MT4) / MetaTrader5 (MT5), you can display the Ichimoku Cloud, a technical indicator developed by Goichi Hosoda (Japan). Based on the Base line, Conversion line, Leading span A, Leading span B, and Lagging span, it helps traders determine when the market will move next. Use the Ichimoku Cloud to understand the power balance between buyers and sellers and predict when the next market shift will occur.
Here we will look at how to add the Ichimoku Cloud to a chart on MT4/MT5.
Switch between MT4/MT5 tabs to check the steps for each.
The Ichimoku Cloud can be set up from the menu or the Navigator.
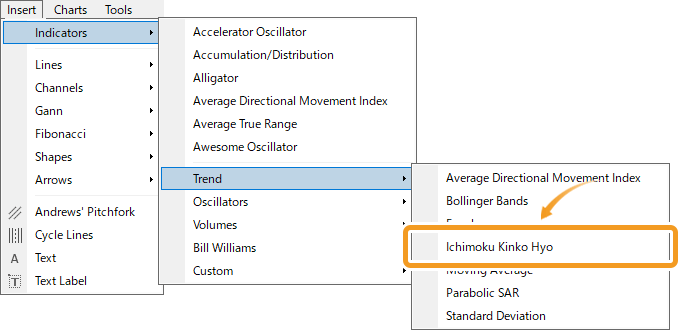
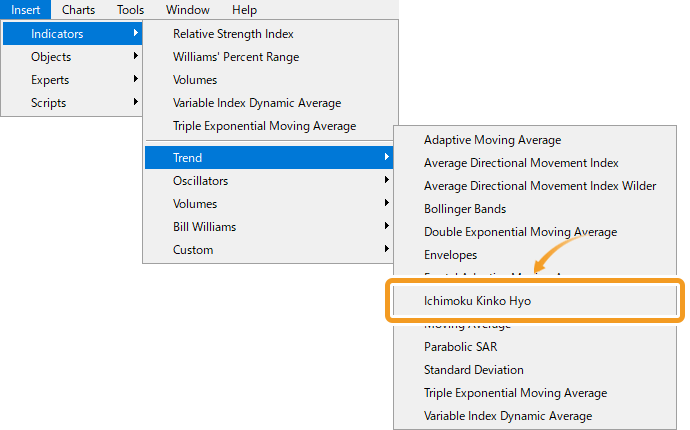
Click "Insert" in the menu. Hover the pointer over "Indicators" > "Trend" and select "Ichimoku Kinko Hyo".
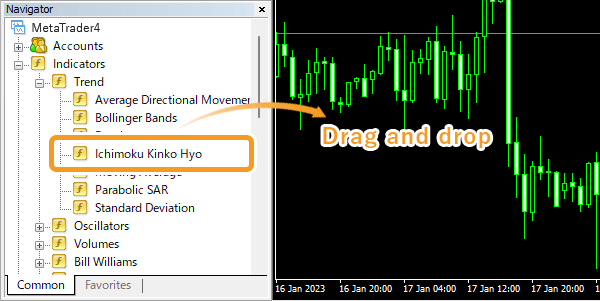
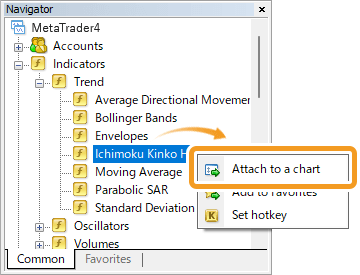
On the Navigator, click on the "+" sign next to "Indicators" and "Trend". Select "Ichimoku Kinko Hyo" and drag it onto the chart you wish to apply it to.
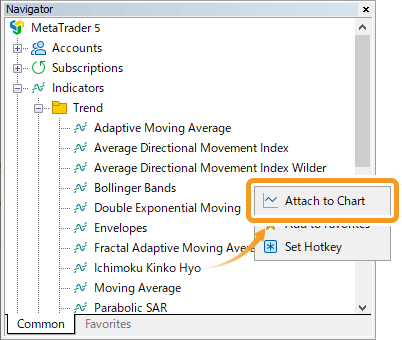
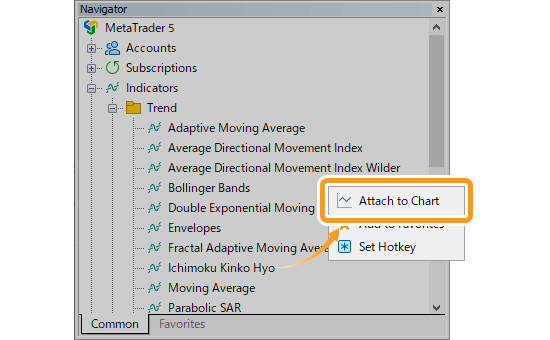
Or, right-click on "Ichimoku Kinko Hyo" and select "Attach to a Chart".
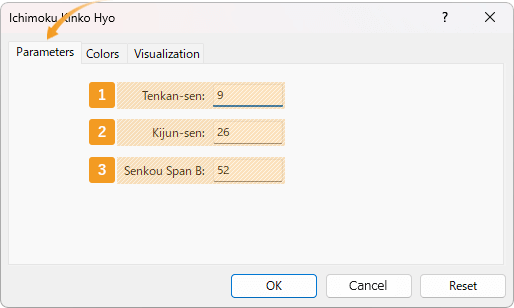
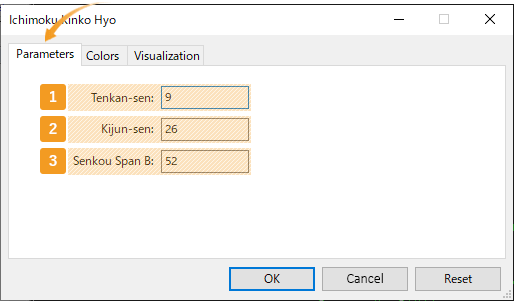
The setting window for Ichimoku Cloud will appear. Set the parameters in the "Parameters", "Colors", and "Visualization" tabs and click "OK".
|
Number |
Item name |
Descriptions |
|---|---|---|
|
1 |
Tenkan-sen |
Set the period for the Conversion line. The unit here is the number of candlesticks. If you select the daily chart and set it to "9", the Conversion line will be formed based on the average of high and low prices for the past 9 days. |
|
2 |
Kijun-sen |
Set the period for the Base line. The unit here is the number of candlesticks. If you select the daily chart and set it to "26", the Base line will be formed based on the average of high and low prices for the past 26 days. |
|
3 |
Senkou Span B |
Set the period for the Leading span B. The unit here is the number of candlesticks. If you select the daily chart and set it to "52", the Leading span B will be formed based on the average of high and low prices for the past 52 days. |
The Ichimoku Cloud consists of 5 lines, the Base line, Conversion line, Leading span A and B, and Lagging span. The time period set for the Base line will be applied for the Leading span A and Lagging span. Leading span A takes the average of the Conversion line and the Base line and shifts it to the future by the time period used for the Base line. The Lagging span takes the closing price and shifts it to the past by the time period used for the Base line.The values for the Ichimoku Cloud are usually not changed.
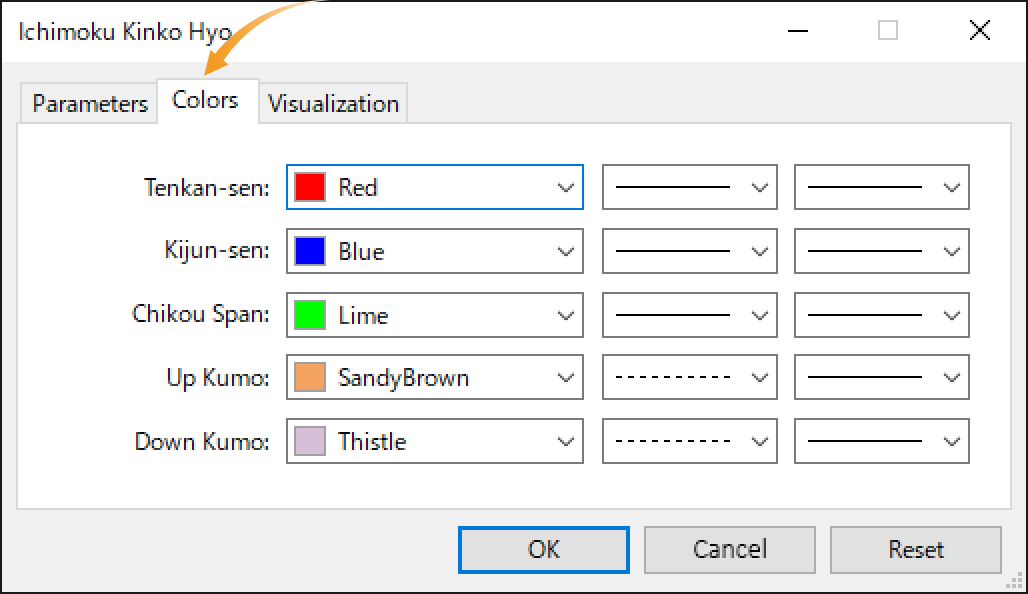
Set the colors, line types, and line thicknesses for Ichimoku Cloud.
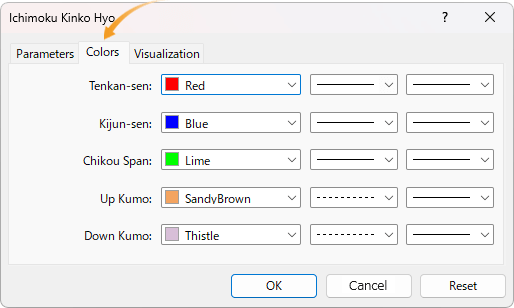
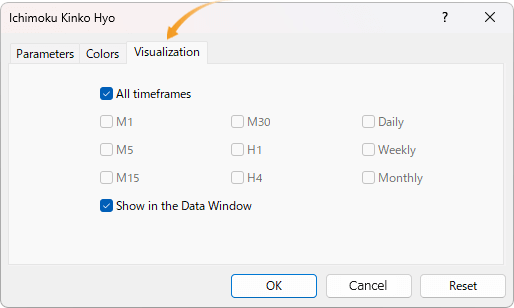
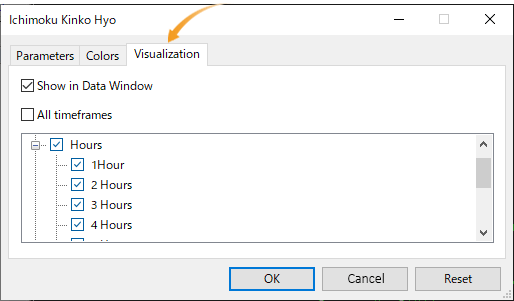
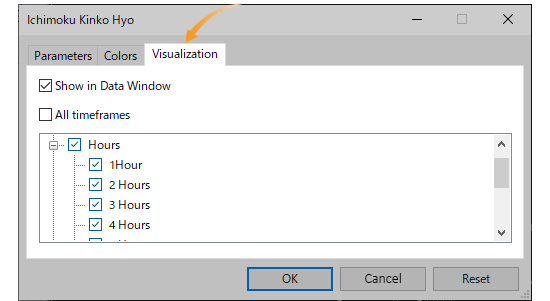
On the "Visualization" tab, you can show/hide Ichimoku Cloud in the Data Window and specify the timeframes to use Ichimoku Cloud with.
Ichimoku Cloud will be displayed on the chart.
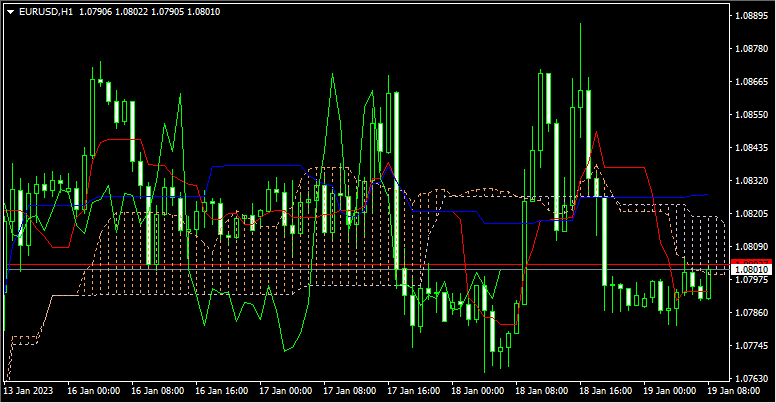
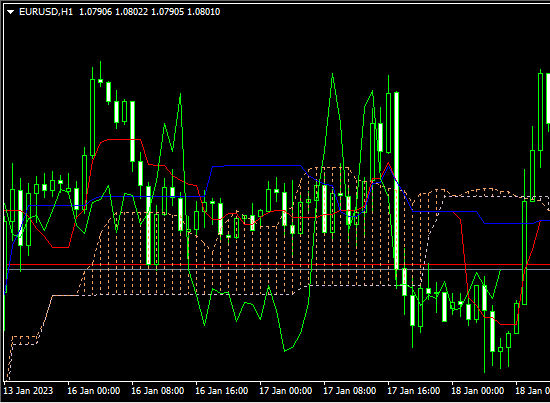
The gap between Leading span A and B is called the "Kumo (Cloud)" and it shows the support and resistance levels. The thicker the cloud, the more likely it is that the strong trend will continue. However, if the gap between Leading span A and B shrinks, it signals a trend shift. If the Base line and Conversion line are close together, keep your eyes open.
The Ichimoku Cloud can be set up from the menu or the Navigator.
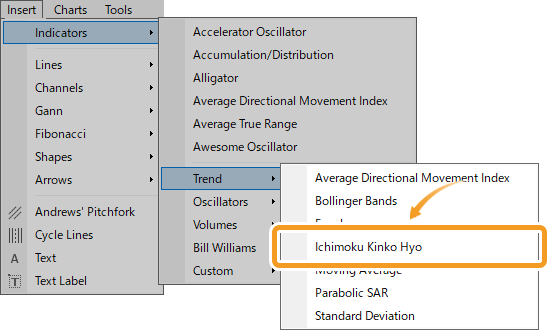
Click "Insert" in the menu. Hover the pointer over "Indicators" > "Trend" and select "Ichimoku Kinko Hyo".
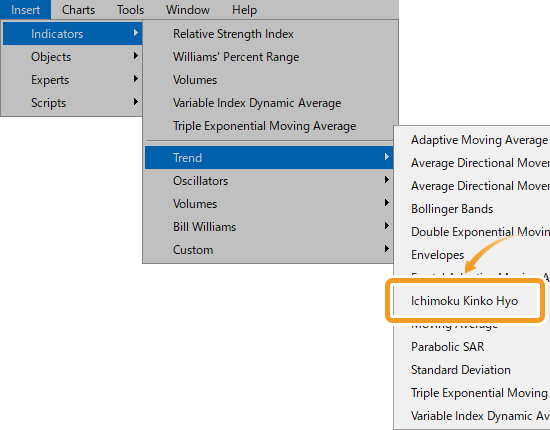
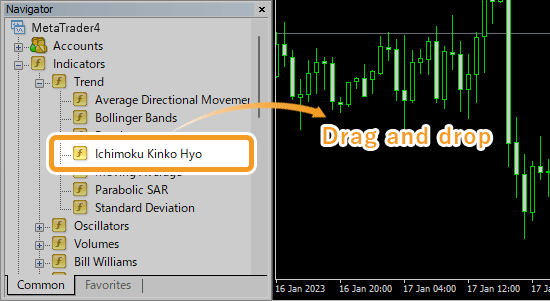
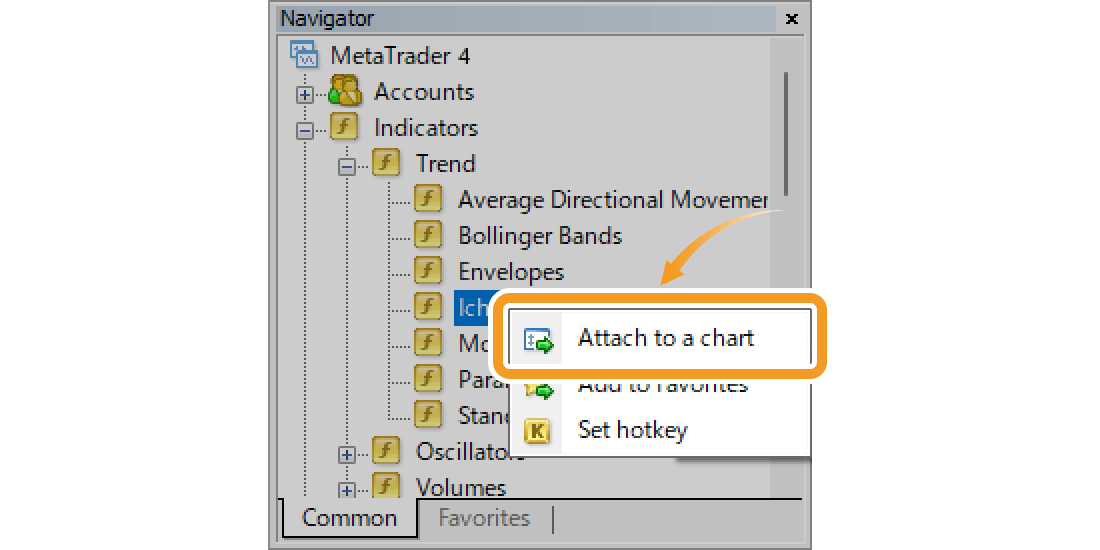
On the Navigator, go to "Indicators" and click on the "+" sign next to "Trend". Select "Ichimoku Kinko Hyo" and drag it onto the chart you wish to apply it to.
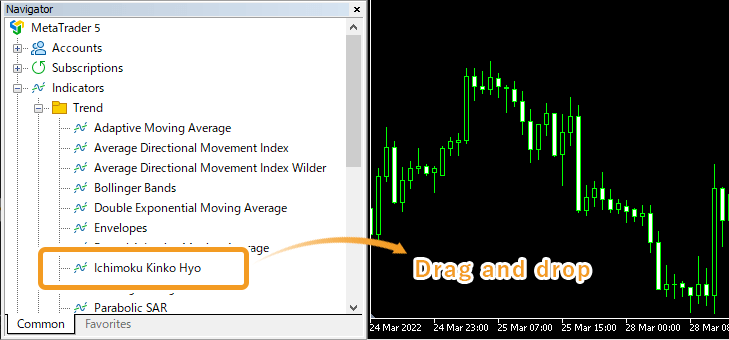
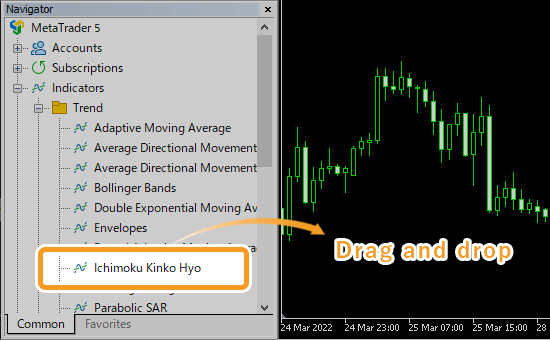
Or, right-click on "Ichimoku Kinko Hyo" and select "Attach to Chart".
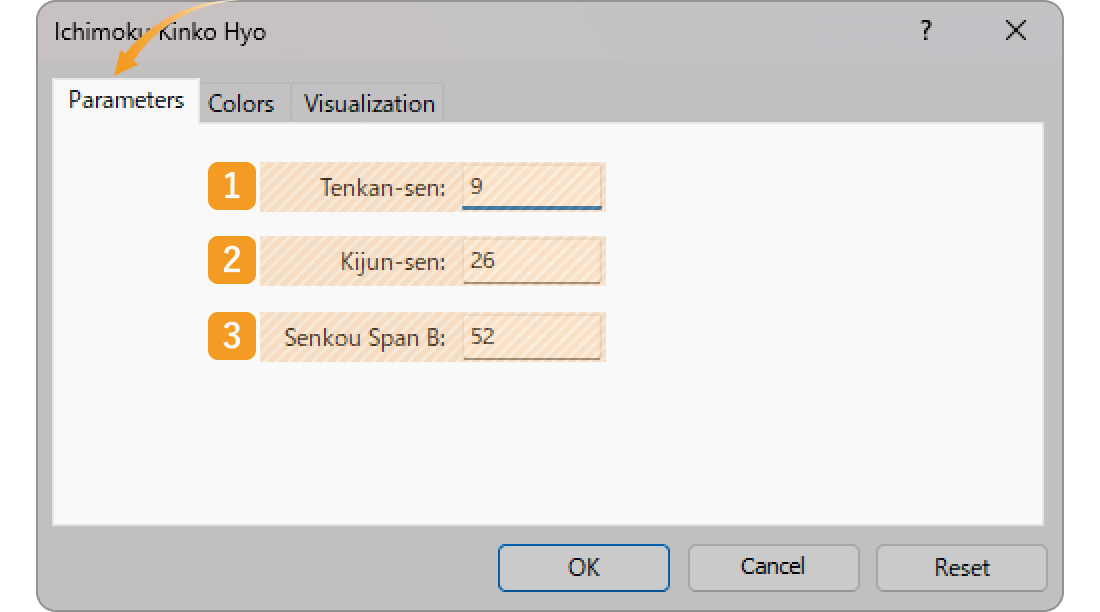
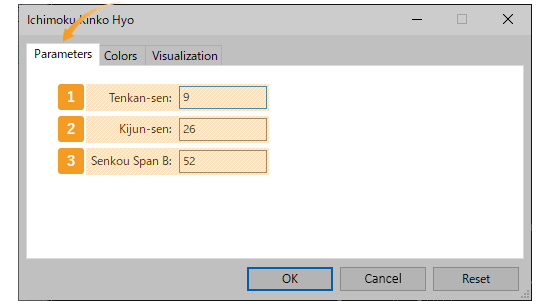
The setting window for Ichimoku Cloud will appear. Set the parameters in the "Parameters", "Colors", and "Visualization" tab and click "OK".
|
Number |
Item name |
Descriptions |
|---|---|---|
|
1 |
Tenkan-sen |
Set the period for Conversion line. The unit here is the number of candlesticks. If you select the daily chart and set it to "9", the Conversion line for the past 9 days will be generated. |
|
2 |
Kijun-sen |
Set the period for Base line. The unit here is the number of candlesticks. If you select the daily chart and set it to "26", the Base line for the past 26 days will be generated. |
|
3 |
Senkou Span B |
Set the period for Leading span. The unit here is the number of candlesticks. If you select the daily chart and set it to "52", the Leading span B for the past 52 days will be generated. |
The Ichimoku Cloud consists of 5 lines, the Base line, Conversion line, Leading span A and B, and Lagging span. The time period set for the Base line will be applied for the Leading span A and Lagging span. Leading span A takes the average of the Conversion line and the Base line and shifts it to the future by the time period used for the Base line. The Lagging span takes the closing price and shifts it to the past by the time period used for the Base line.The values for the Ichimoku Cloud are usually not changed.
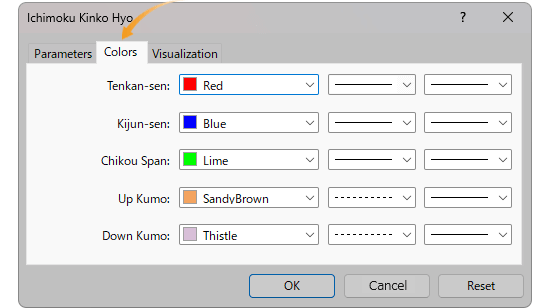
Set the color, line type, and line thickness for Ichimoku Cloud.
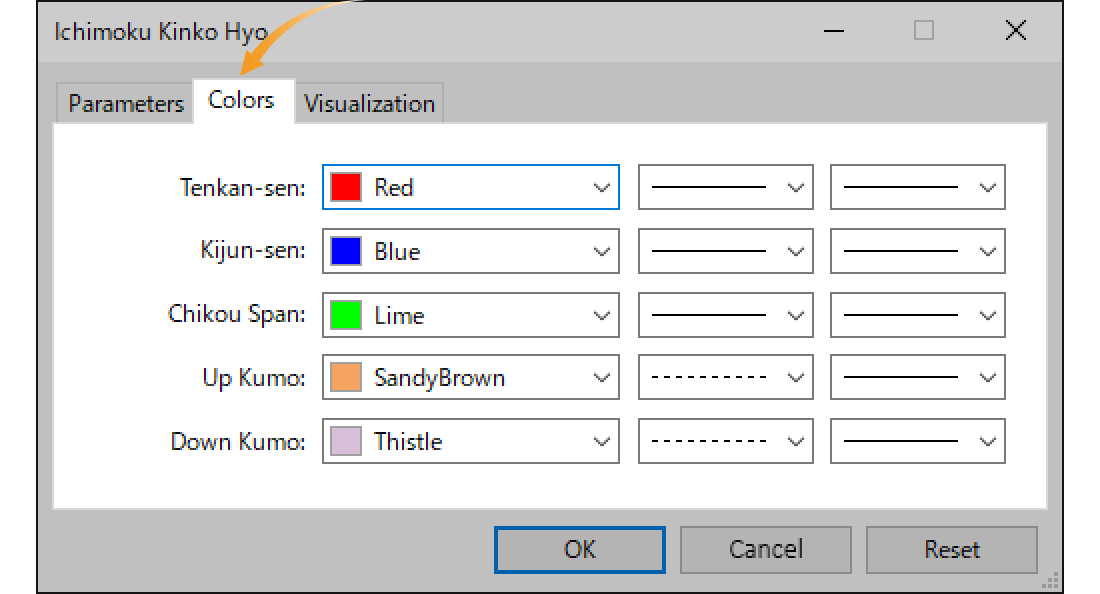
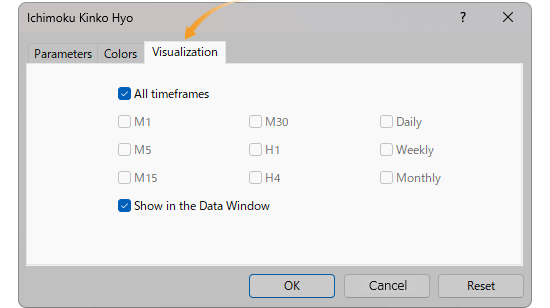
On the "Visualization" tab, you can show/hide Ichimoku Cloud in the Data Window and specify the timeframes to use Ichimoku Cloud with.
Ichimoku Cloud will be displayed on the chart.
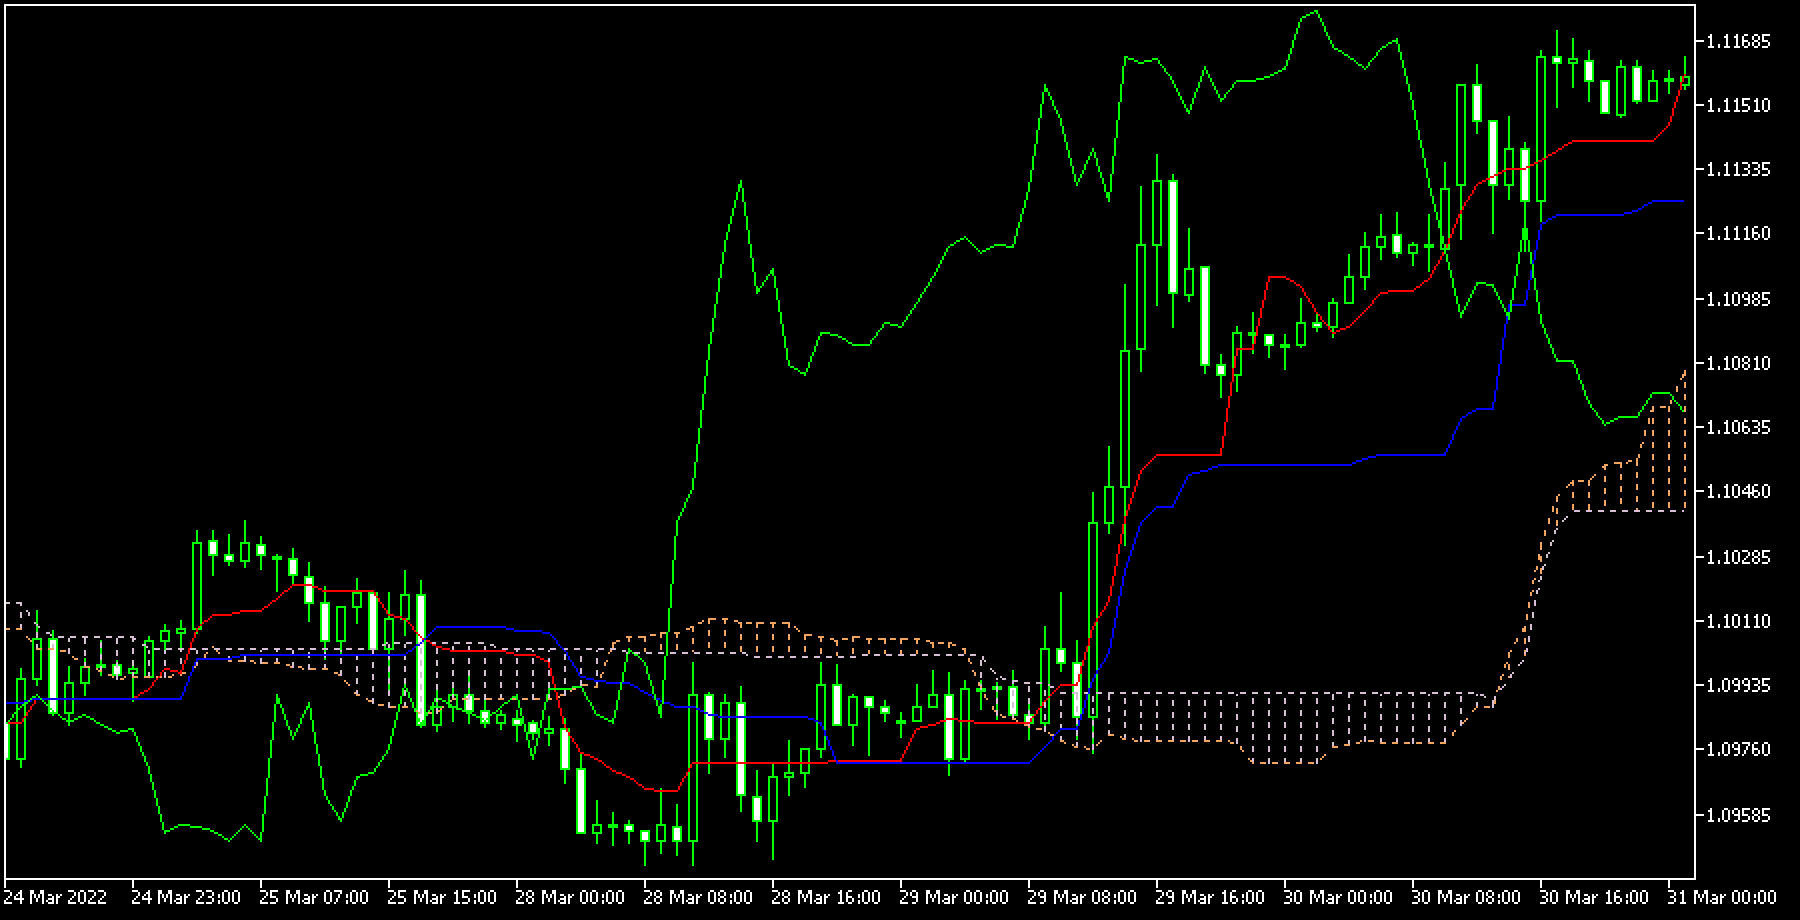
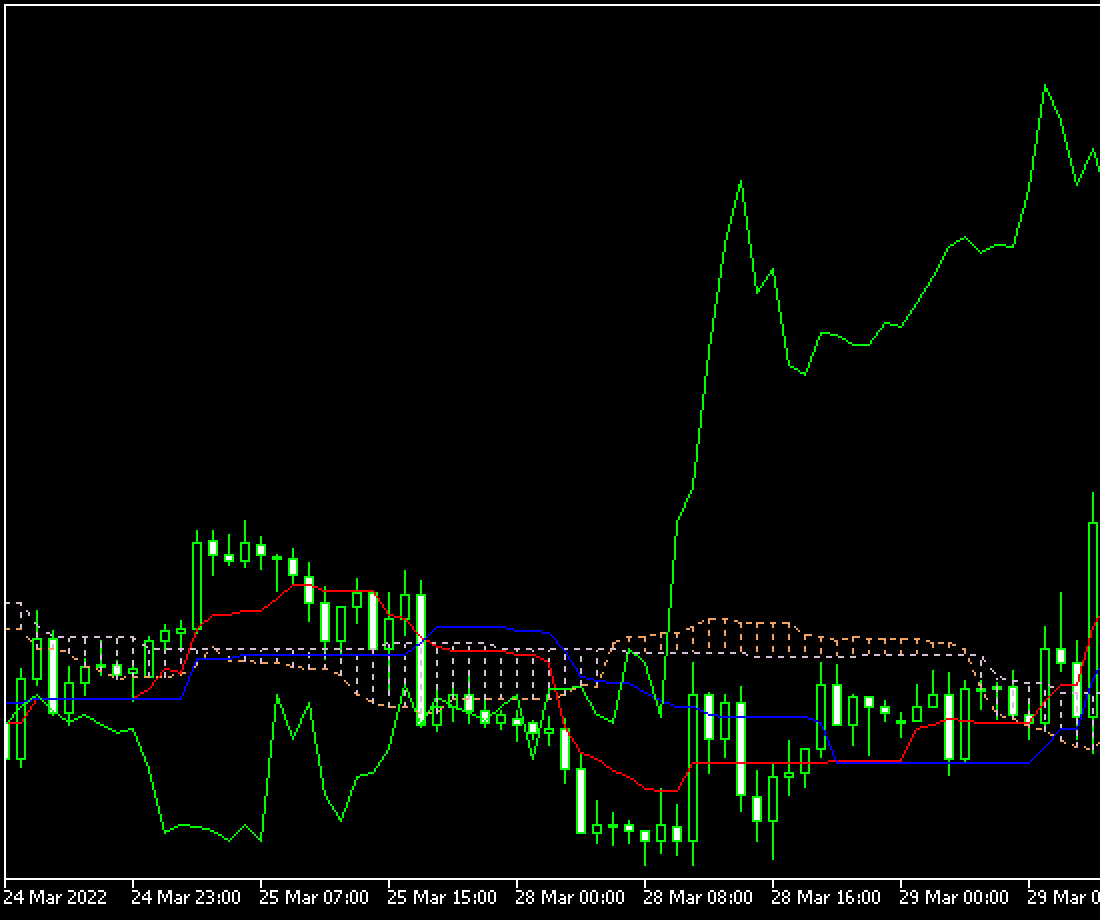
The gap between Leading span A and B is called the "Kumo (Cloud)" and it shows the support and resistance levels. The thicker the cloud, the more likely it is that the strong trend will continue. However, if the gap between Leading span A and B shrinks, it signals a trend shift. If the Base line and Conversion line are close together, keep your eyes open.
![]()
Created
: 2022.07.27
![]()
Last updated
: 2025.10.12

Nakamaru is a manual production consultant at FINTECS, a company that specializes in creating manuals for their clients.
With a wide range of experience from fintech to entertainment, he presents what user-friendly manuals should be like.
He works with numerous large corporations as an external manual production project manager.
【Business information】
http://www.fintecs.co.jp/profile/
Akira Takagi
Systems engineer, MetaTrader administrator

After graduating from Computer Science at the Uninove, Brazil, in 2014, he has worked on various systems development projects.
He participated as a developer in the launch of forex services in 2019. Since then, he has also been involved in the development of MetaTrader plugins and APIs. He is certified by MetaQuotes as a MetaTrader5 Administrator and active in consulting and advisory as well.
We hope you find this article useful. Any comments or suggestions will be greatly appreciated.
We are also looking for writers with extensive experience in forex and crypto to join us.
please contact us at [email protected].
Disclaimer:
All information and content provided on this website is provided for informational purposes only and is not intended to solicit any investment. Although all efforts are made in order to ensure that the information is correct, no guarantee is provided for the accuracy of any content on this website. Any decision made shall be the responsibility of the investor and Myforex does not take any responsibility whatsoever regarding the use of any information provided herein.
The content provided on this website belongs to Myforex and, where stated, the relevant licensors. All rights are reserved by Myforex and the relevant licensors, and no content of this website, whether in full or in part, shall be copied or displayed elsewhere without the explicit written permission of the relevant copyright holder. If you wish to use any part of the content provided on this website, please ensure that you contact Myforex.
Myforex uses cookies to improve the convenience and functionality of this website. This website may include cookies not only by us but also by third parties (advertisers, log analysts, etc.) for the purpose of tracking the activities of users. Cookie policy