


Created
: 2022.09.09


On MetaTrader4 (MT4) / MetaTrader5 (MT5), you can use the technical indicators based on the Fibonacci sequence: "Fibonacci retracement", "Fibonacci time zones", "Fibonacci fan", "Fibonacci arcs", "Fibonacci channel", and "Fibonacci expansion".
Here we'll take a look at how to display and set up the simplest Fibonacci tool, the Fibonacci retracement.
Switch between MT4/MT5 tabs to check the steps for each.
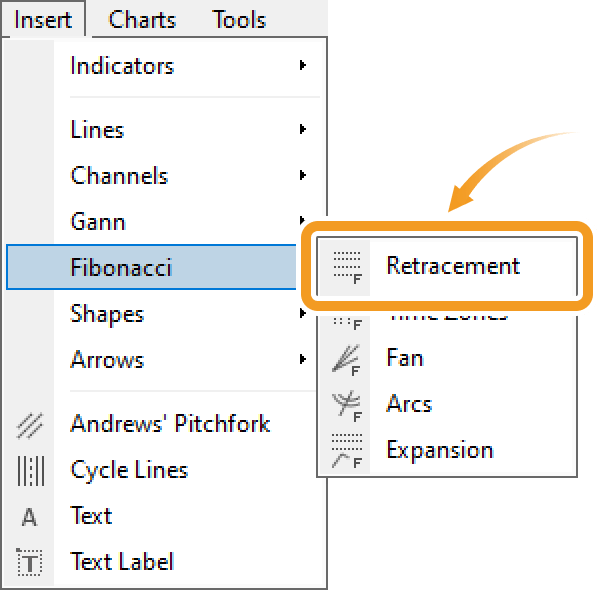
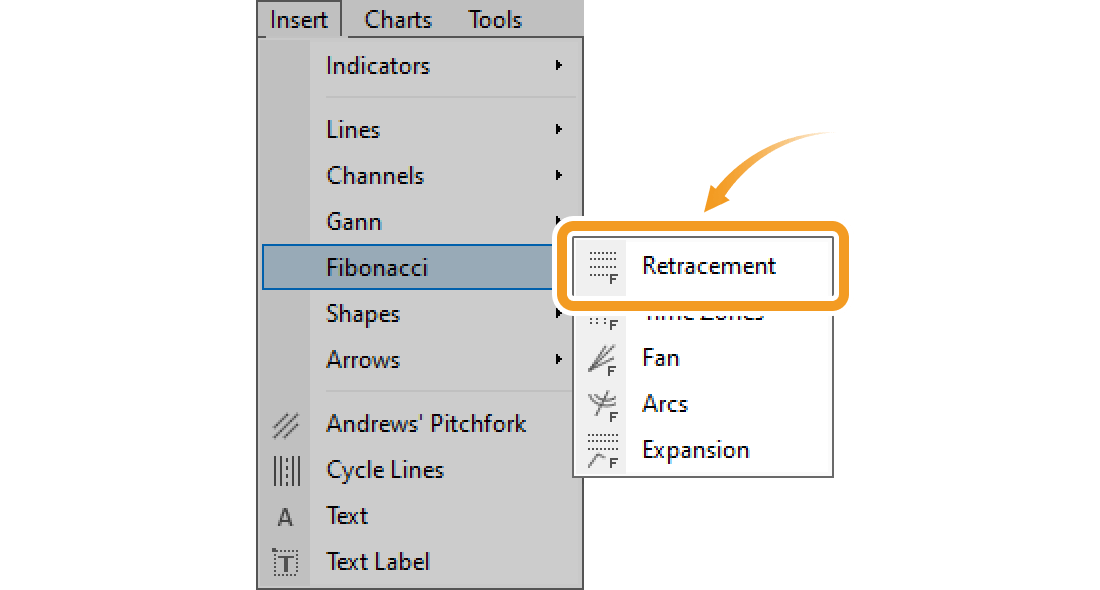
Fibonacci retracement is available from the menu or the Toolbar.
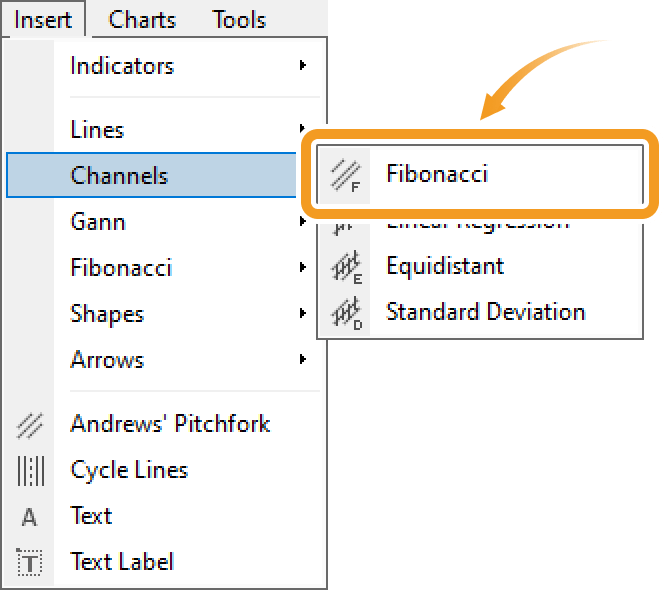
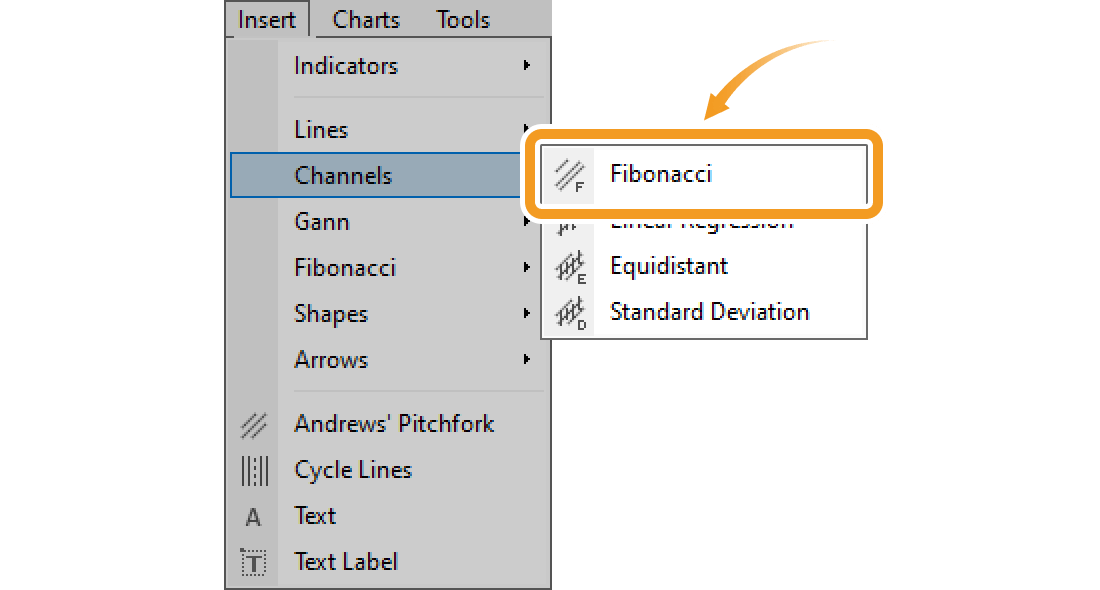
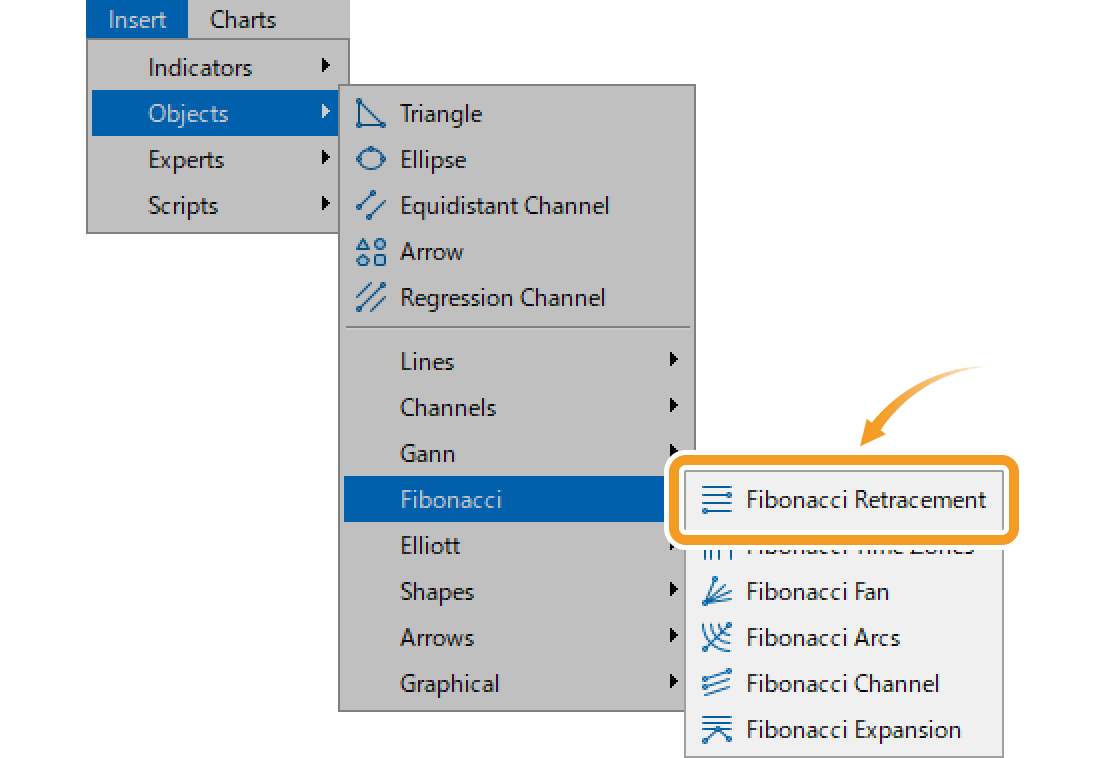
Click "Insert" in the menu. Hover the pointer over "Fibonacci" and select "Retracement".
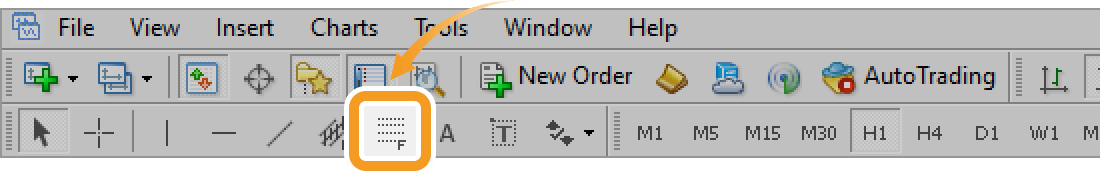
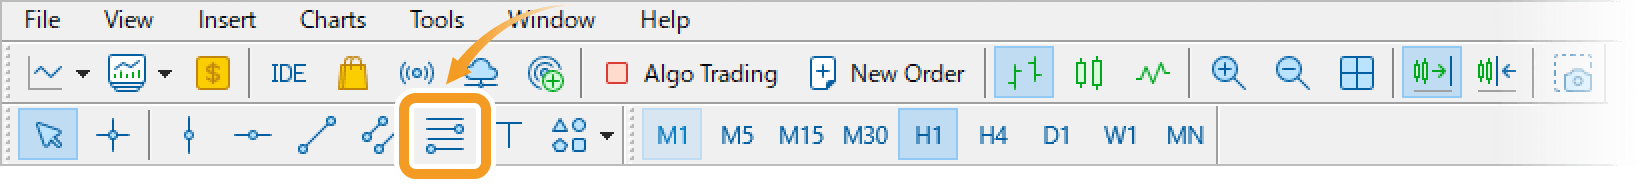
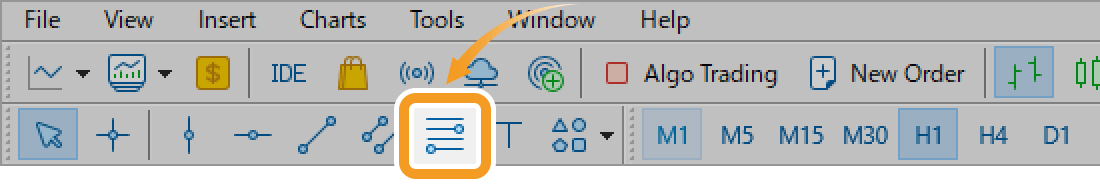
Click the "Draw Fibonacci retracement" button in the toolbar.

Fibonacci retracement
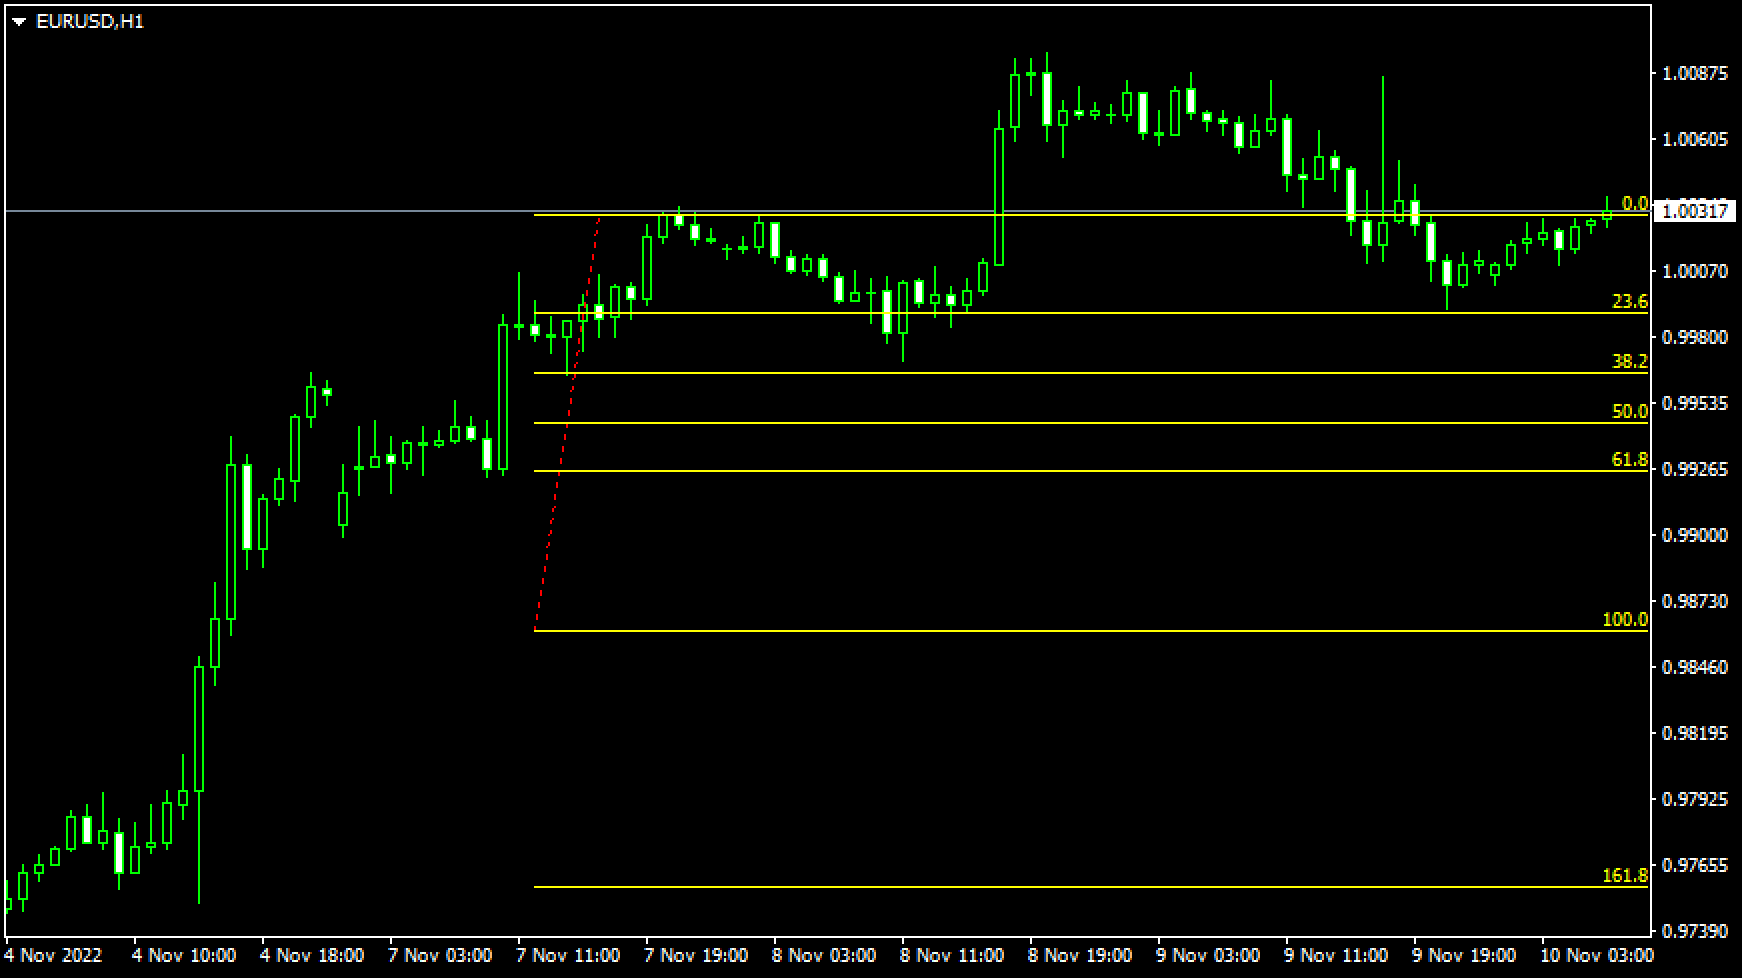
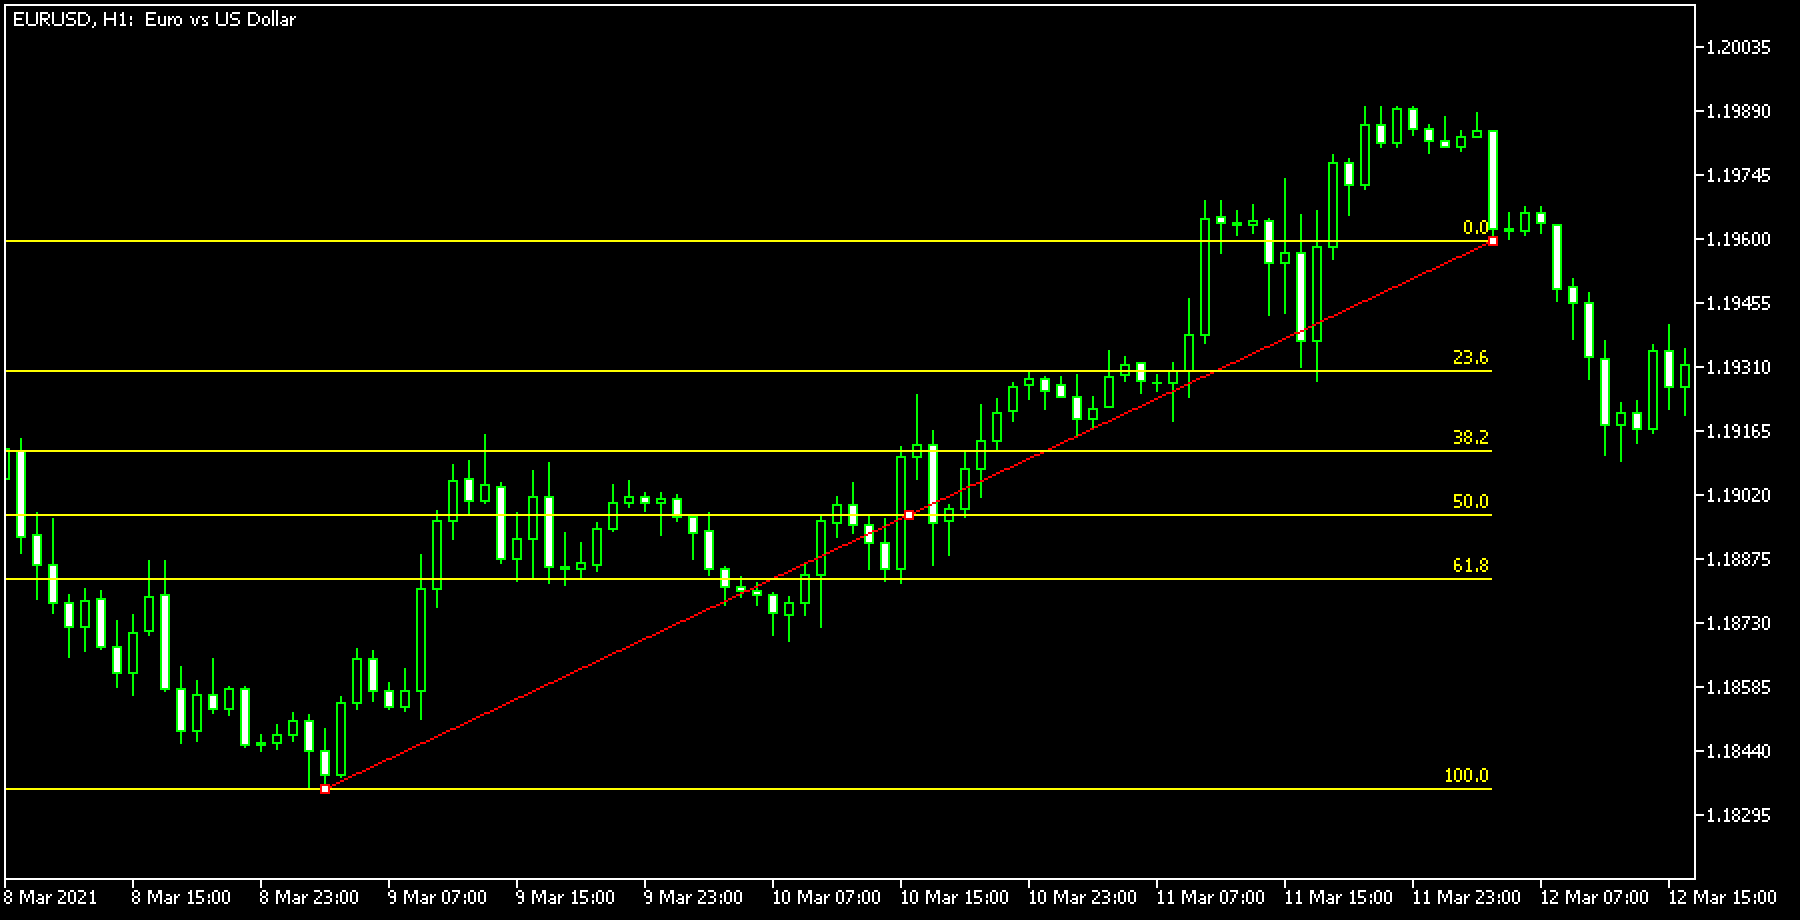
Fibonacci retracement is a technical indicator that determines the temporary retrace price. It uses the Fibonacci ratio on the gap between the high and low to determine the dip/rally.
Fibonacci time zones
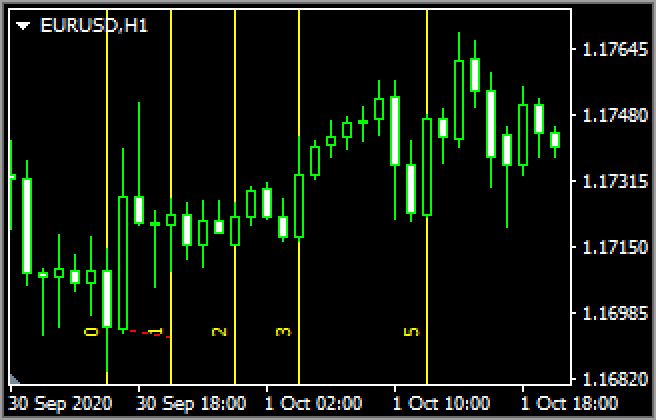
Fibonacci time zones draw vertical Fibonacci lines relative to the time axis. Use these as reference points to determine when the trend will change.
Fibonacci fan
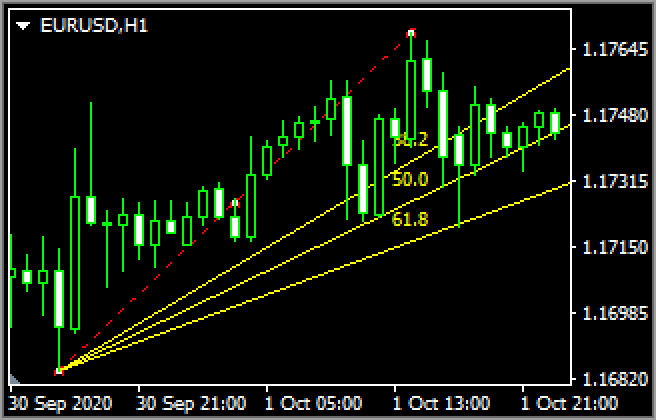
Fibonacci fan draws 3 separate trendlines distanced from a starting point based on the Fibonacci ratio when you select the starting and end points of a wave. Use these lines as reference points to determine the support line and resistance line.
Fibonacci arcs
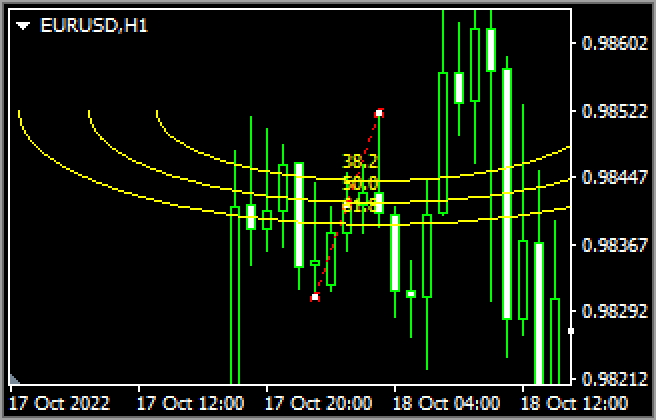
Fibonacci arc is a technical indicator that utilizes the Fibonacci ratio on the price gap and time. Connect the high and low and it will draw 3 arcs relative to the end point using the Fibonacci ratio. Use these lines as reference points to determine the support line and resistance line.
Fibonacci expansion
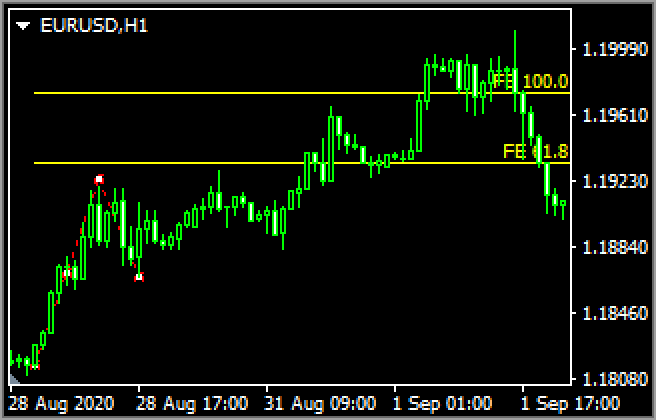
Fibonacci expansion is a technical indicator that determines how long a trend will last. Connect the starting point of the trend and the dip/rally points and it will draw horizontal lines using the Fibonacci ratio. Use these as reference points to determine how far the market will expand.
On MT5, you can find the Fibonacci channel in the "Fibonacci" menu, while on MT4, it is in the "Channels" menu.
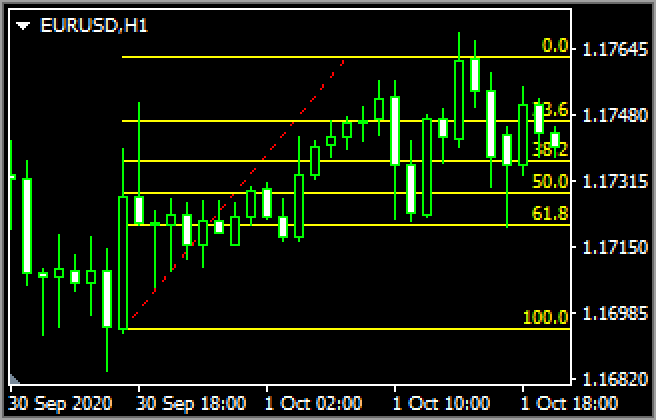
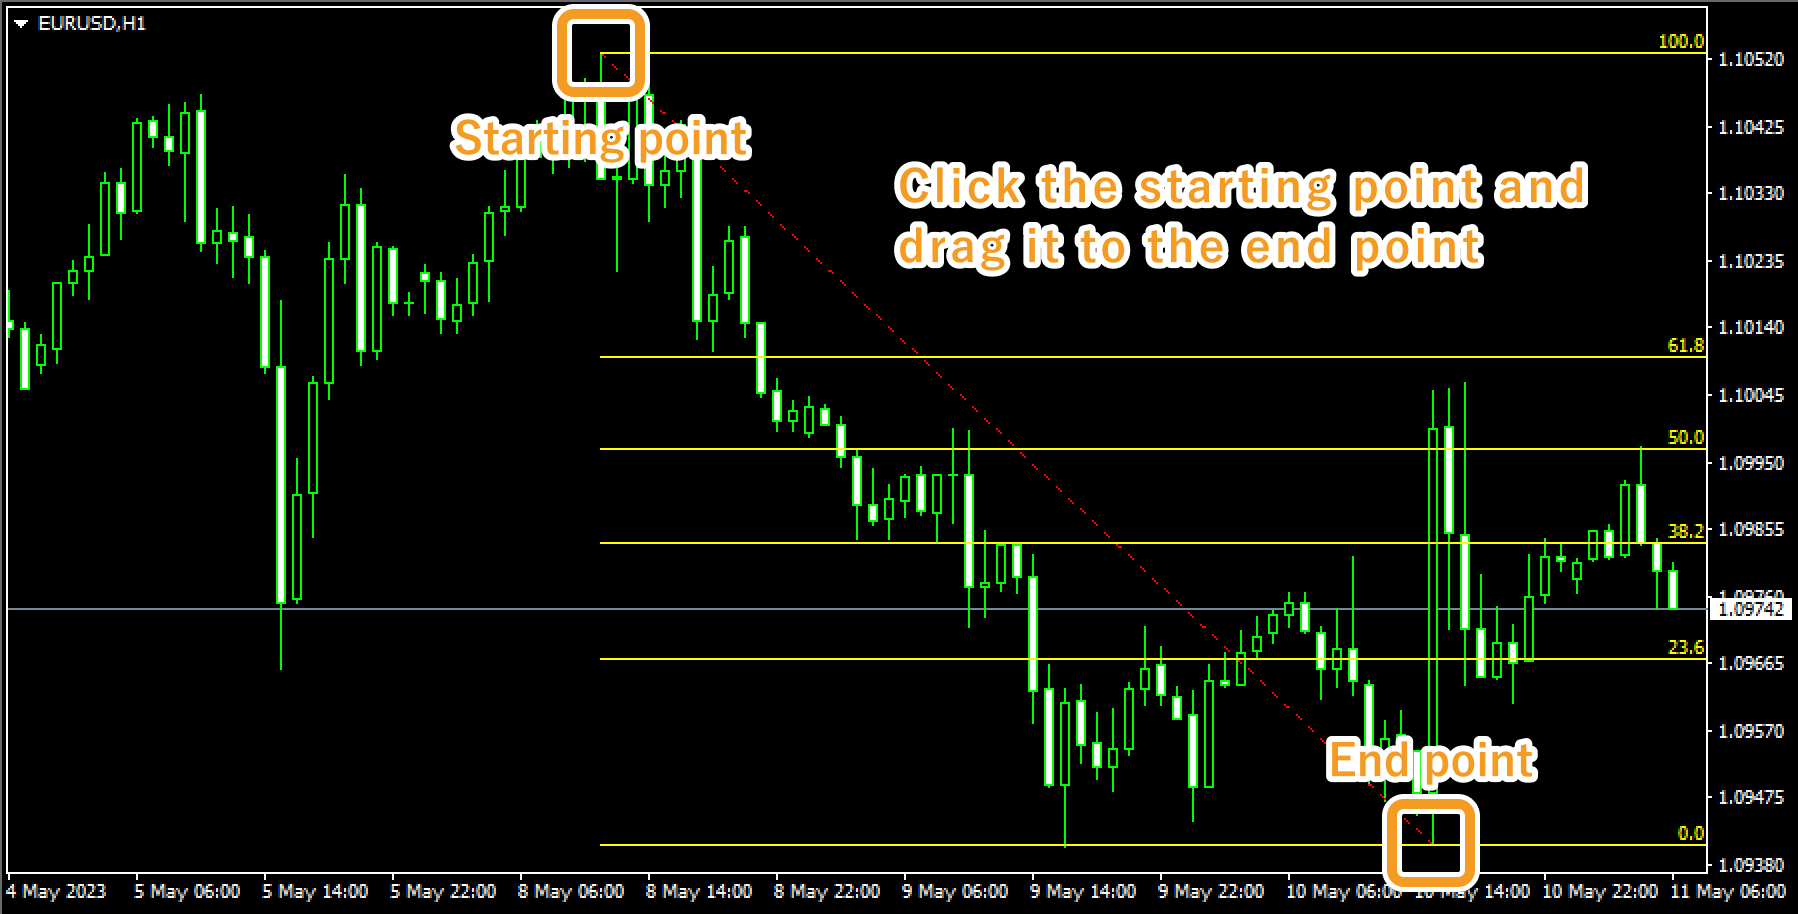
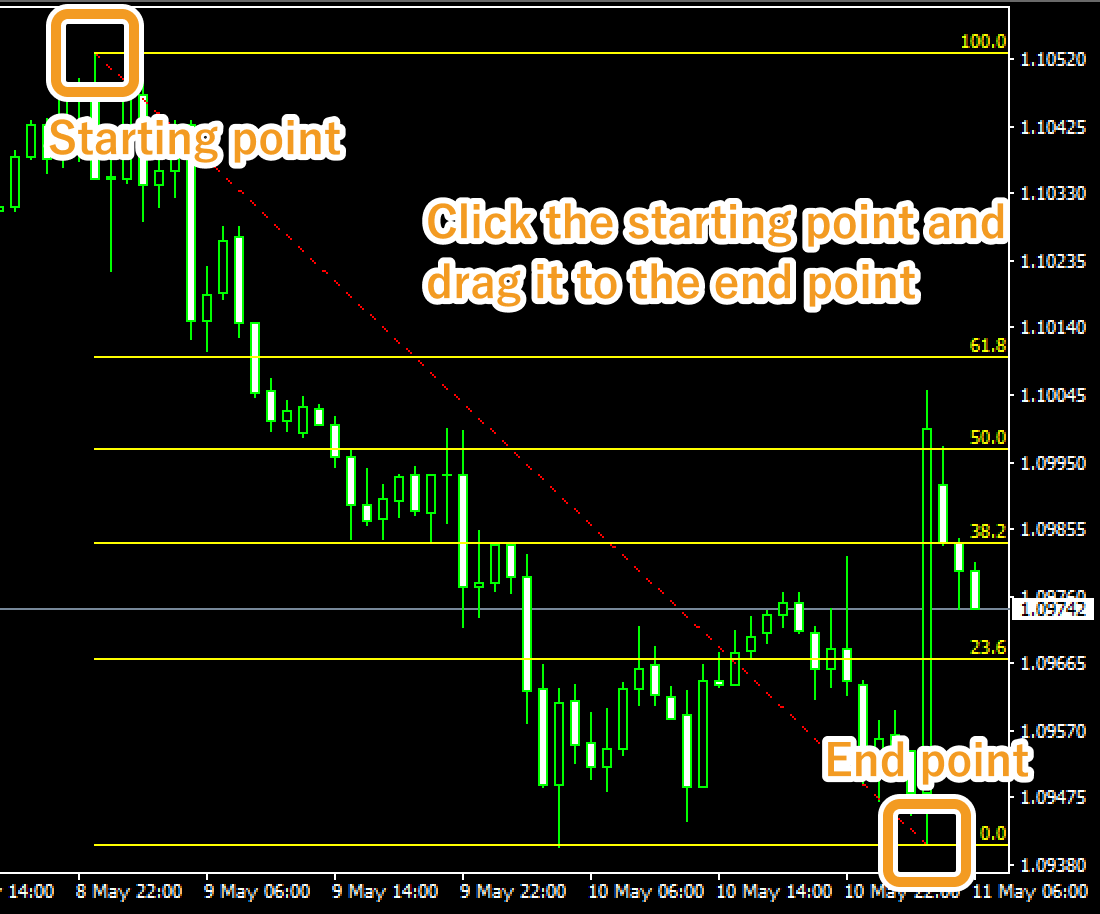
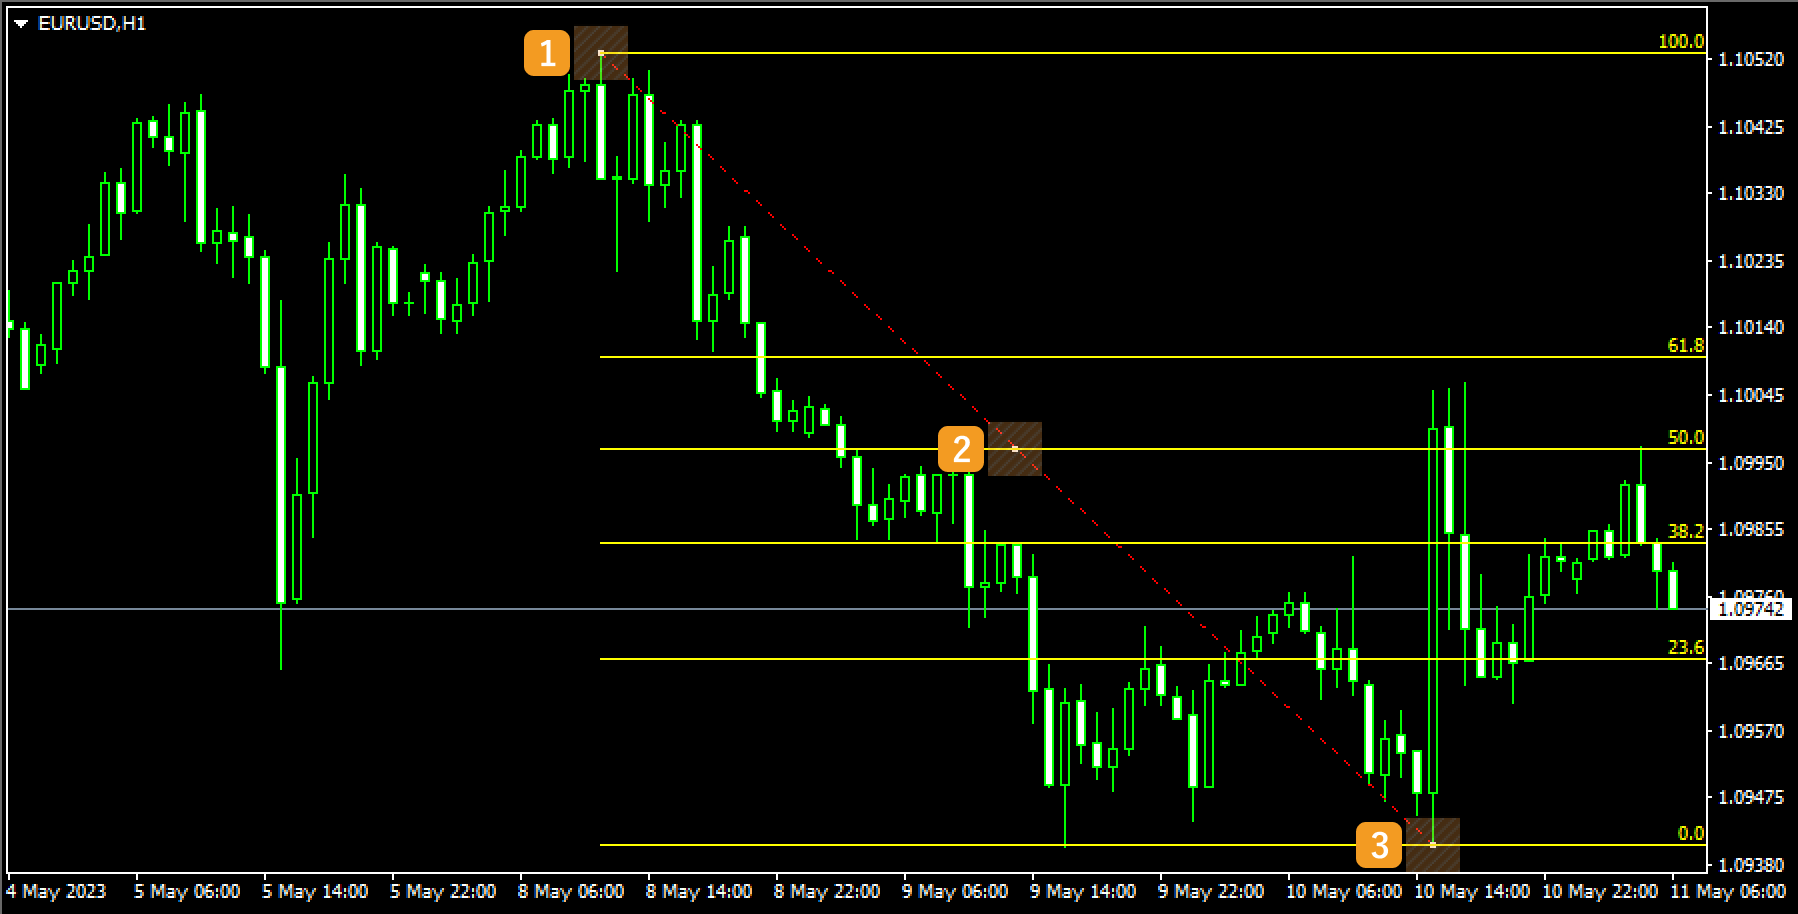
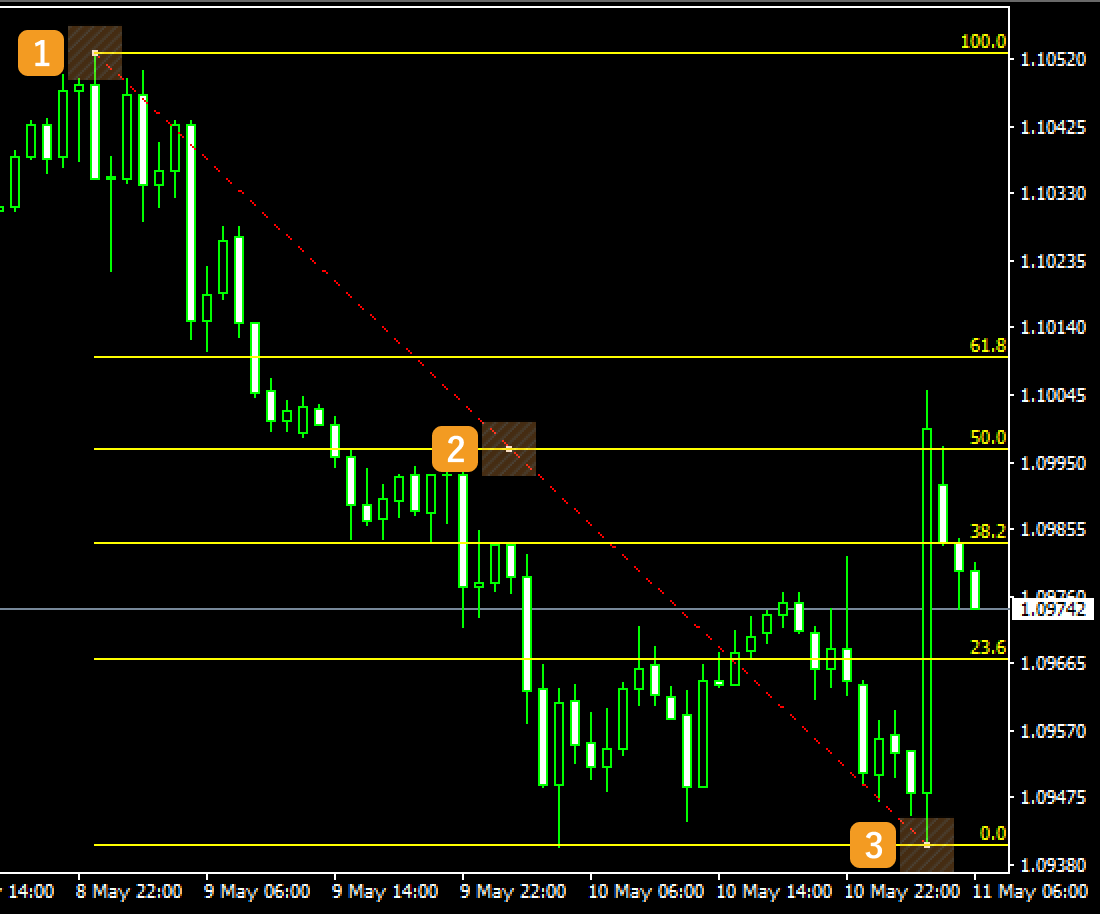
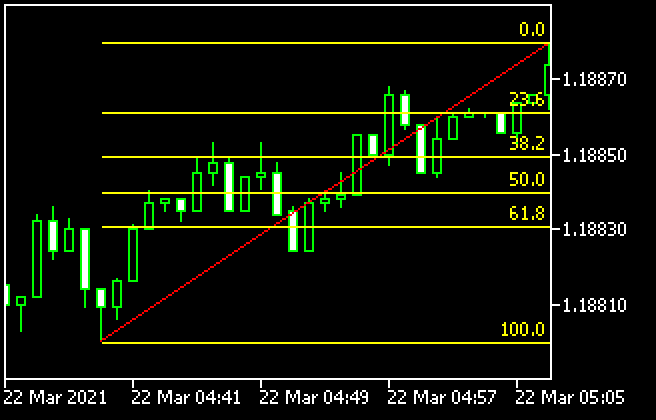
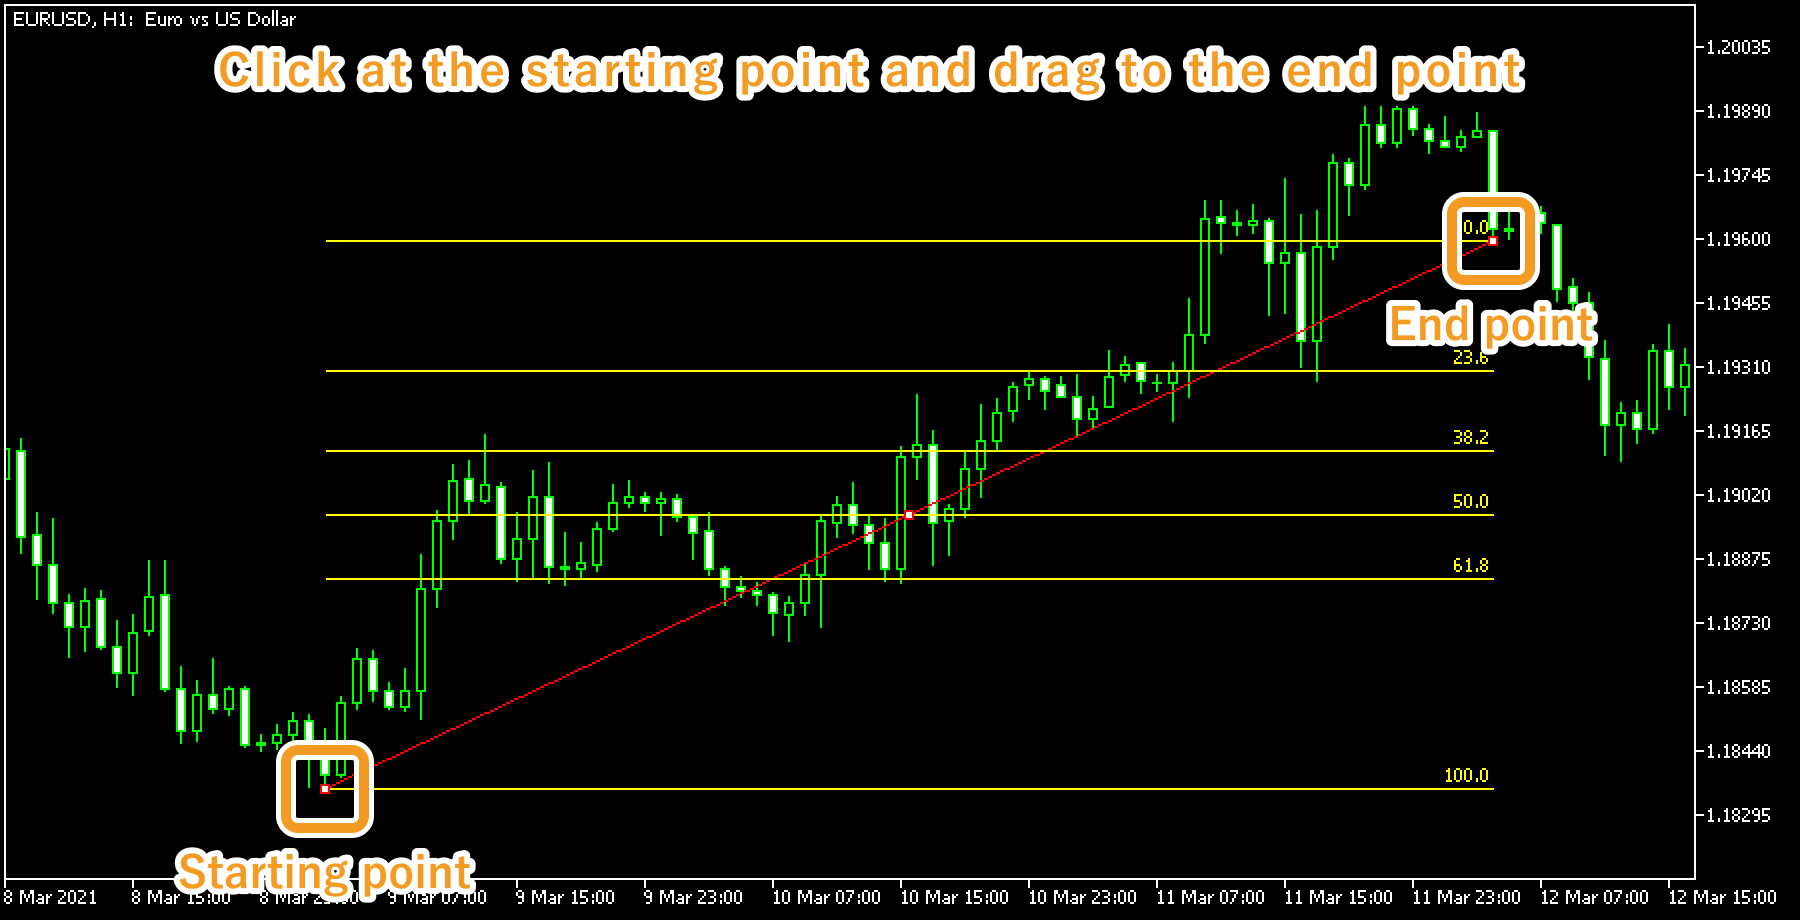
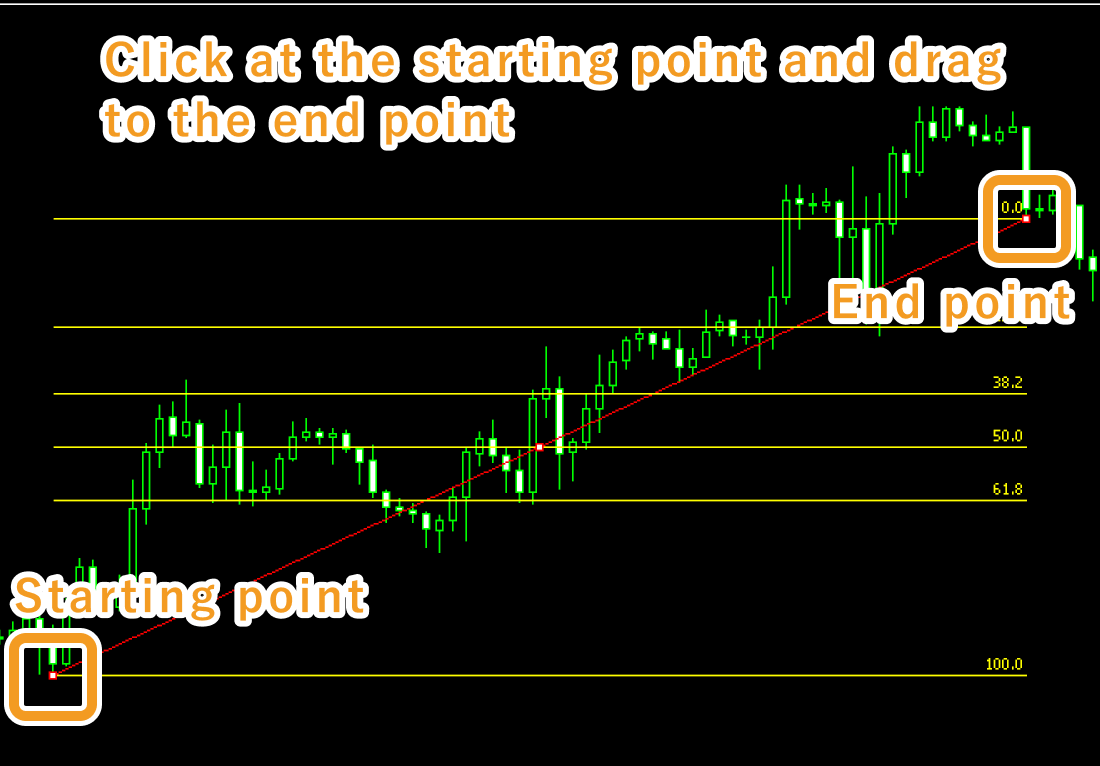
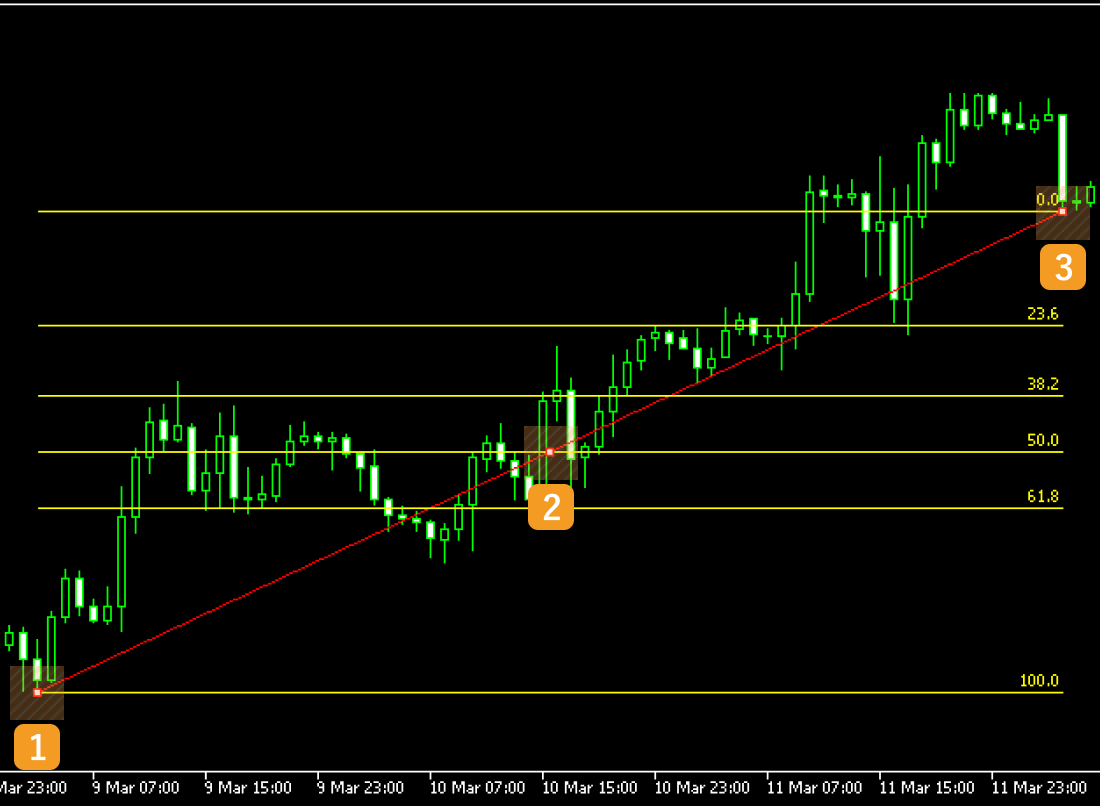
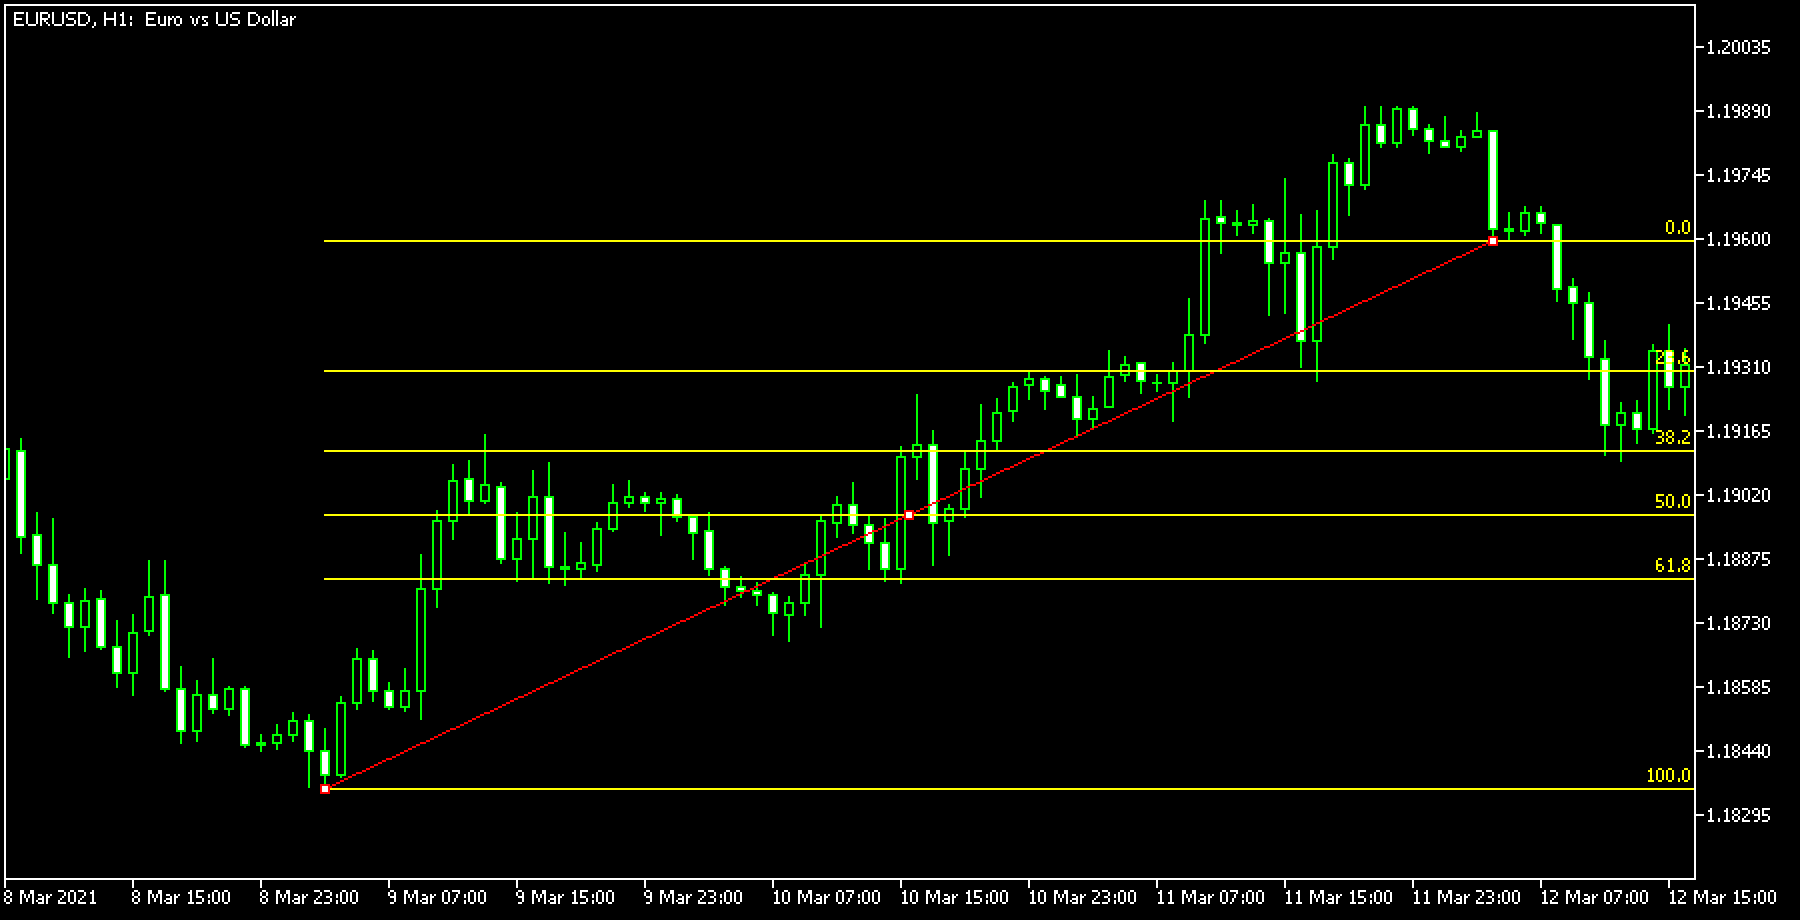
Click the starting point on the chart and drag it to the end point to create the Fibonacci retracement.
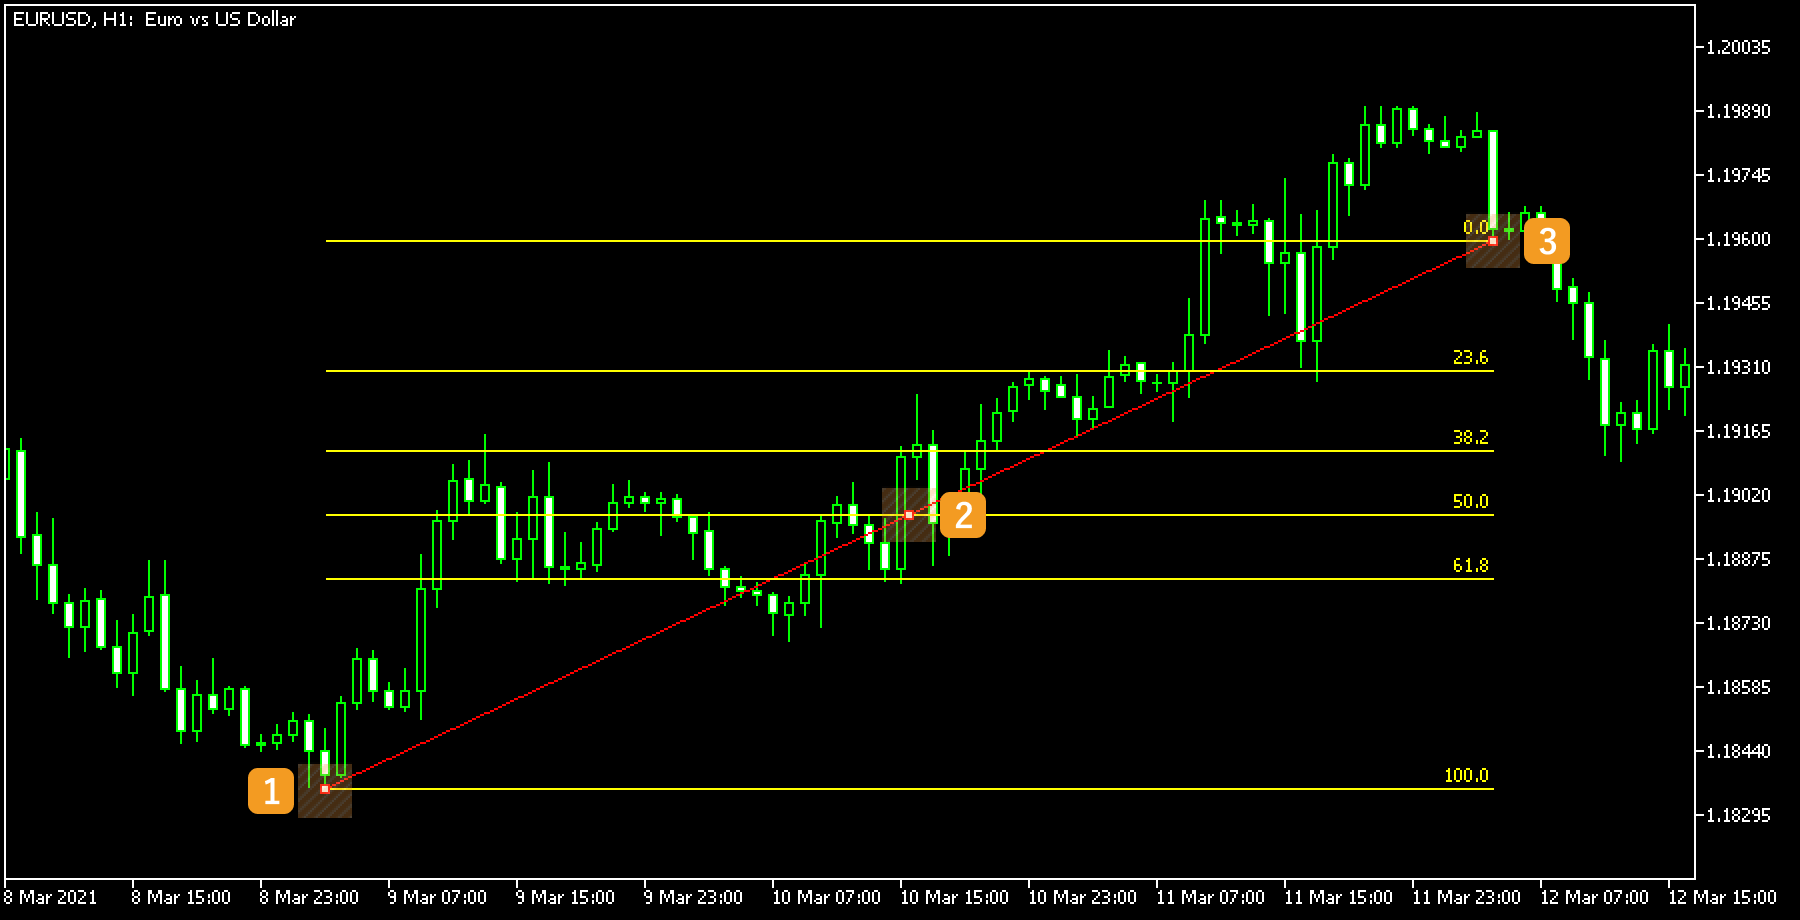
If you want to adjust the position of the Fibonacci retracement, make sure the white dots are being displayed on the Fibonacci retracement and move each dot as necessary. If you cannot see the white dots, double-click near the line connecting the starting and end points to display the white dots.
|
Number |
Descriptions |
|---|---|
|
1 |
Change the starting point of the Fibonacci retracement. |
|
2 |
Change the position of the Fibonacci retracement. |
|
3 |
Change the end point of the Fibonacci retracement. |
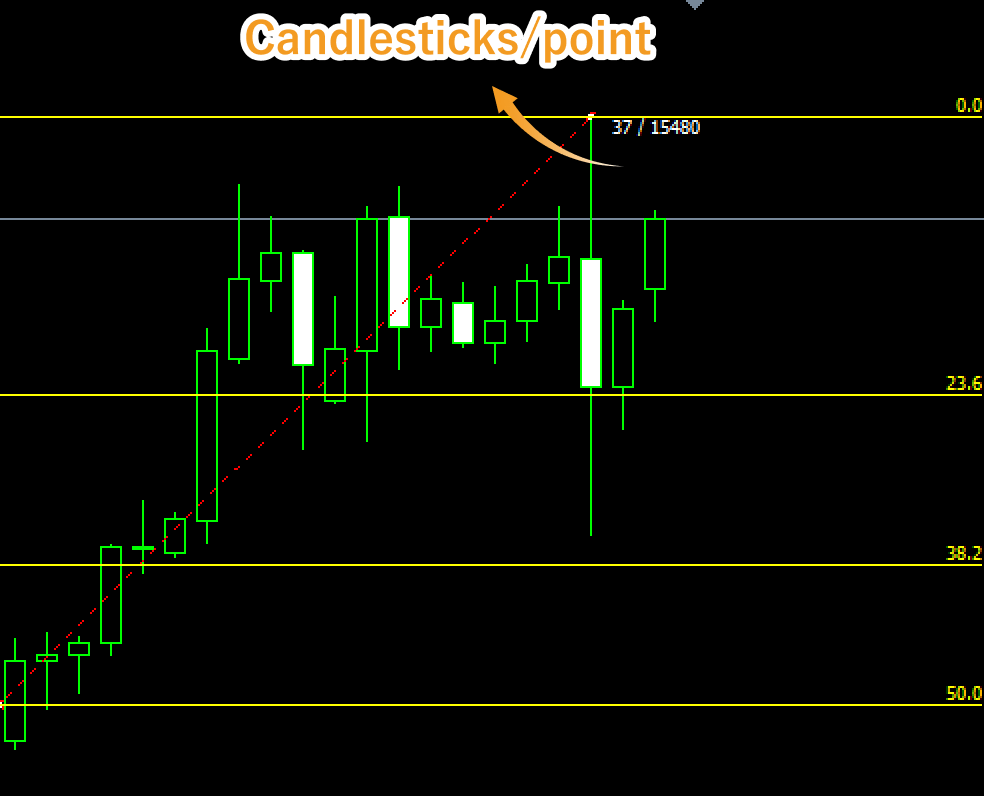
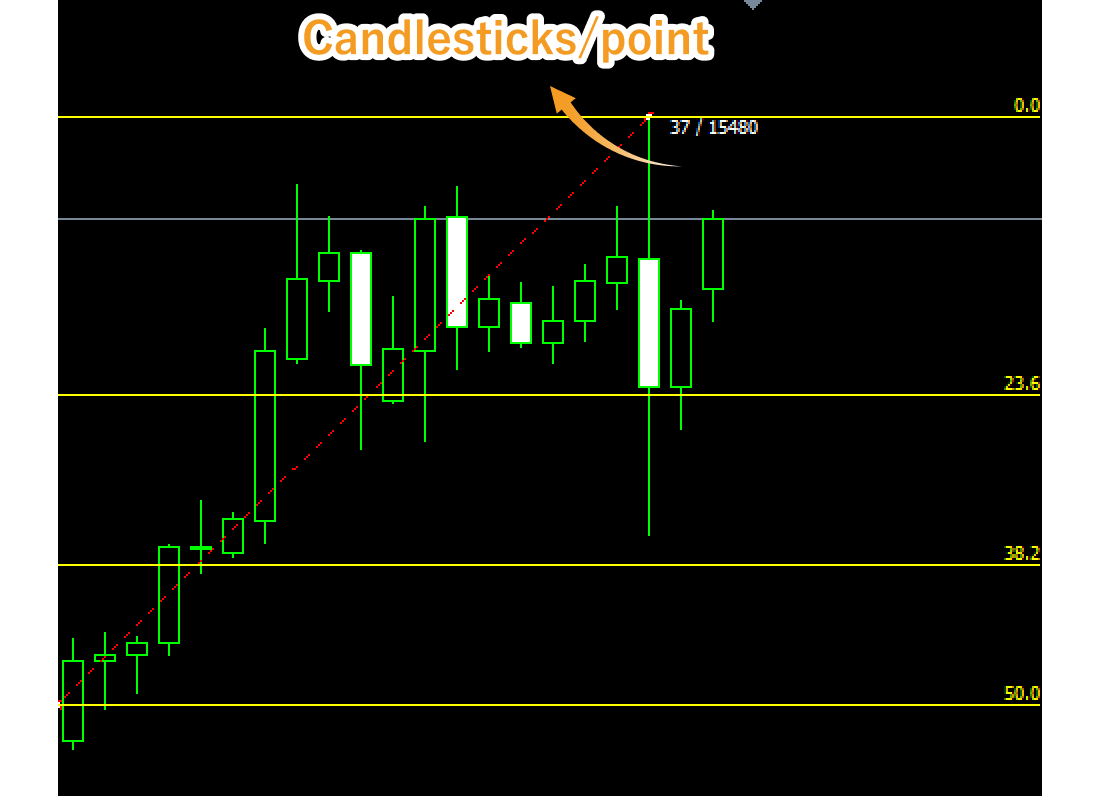
Values displayed when dragging the starting or end point indicate the numbers of candlesticks and points from the starting point to the end point.
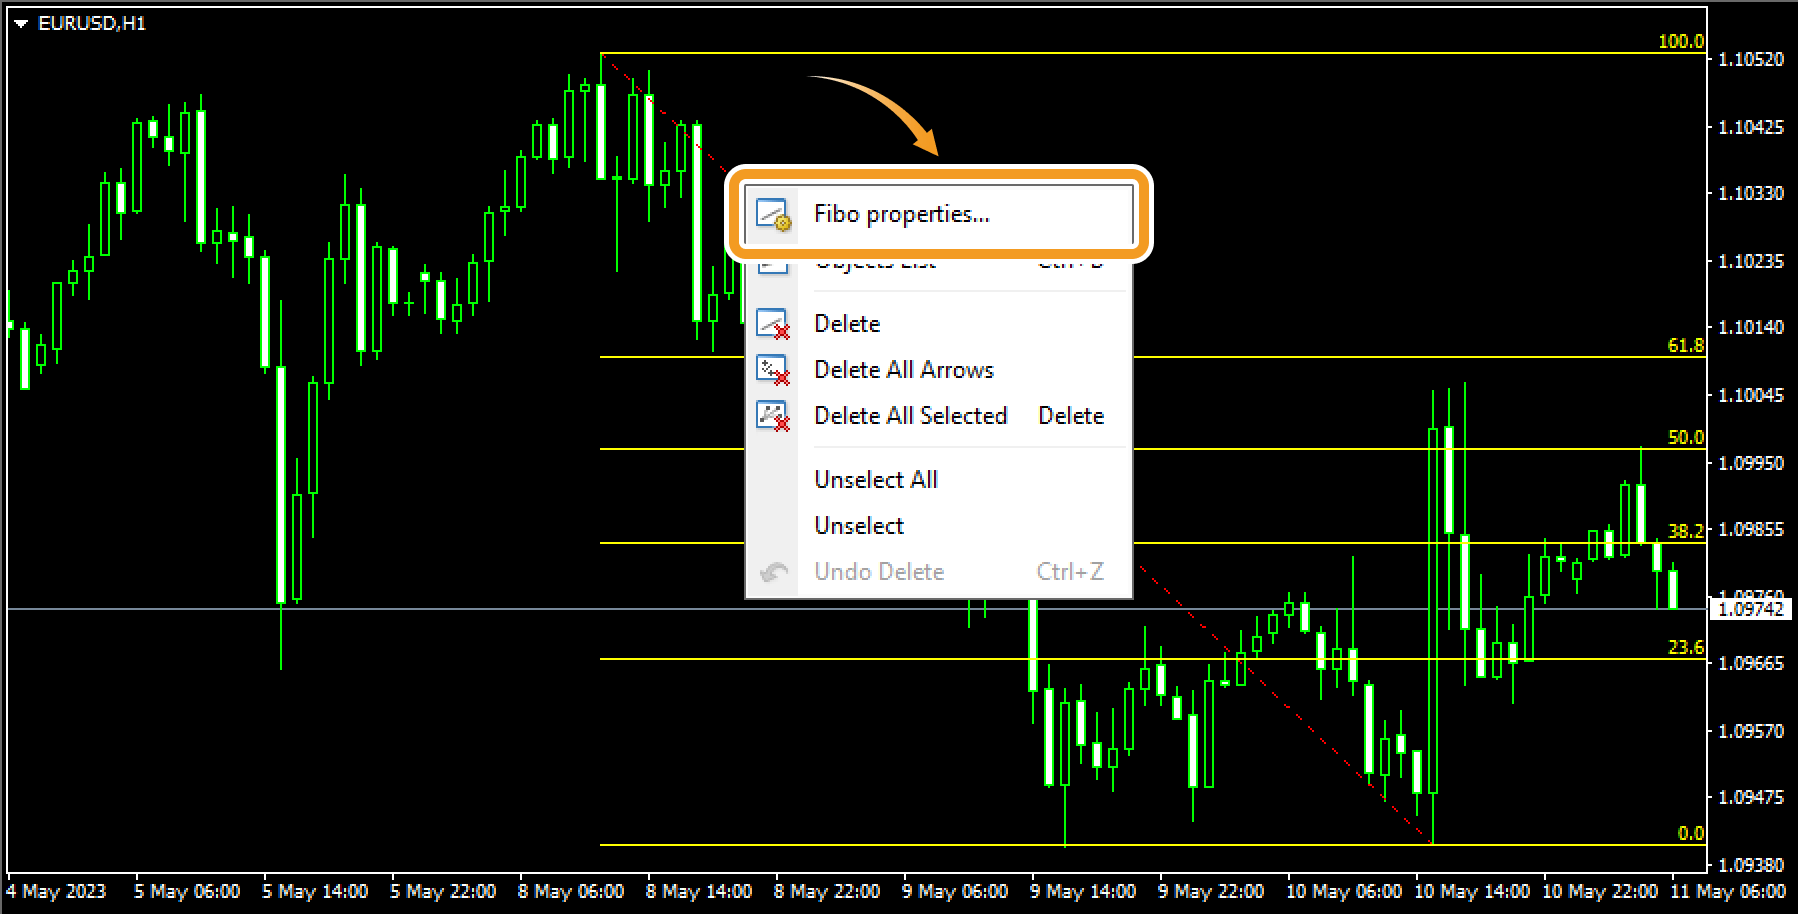
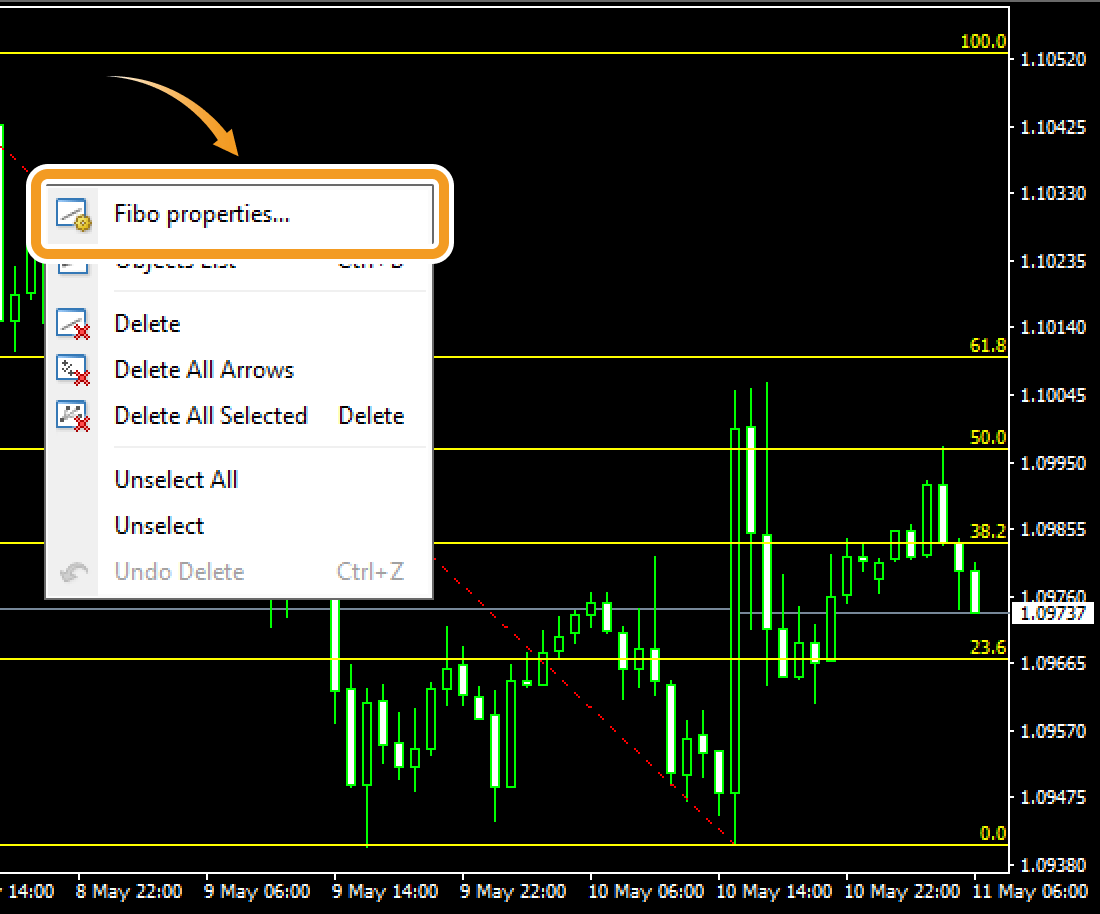
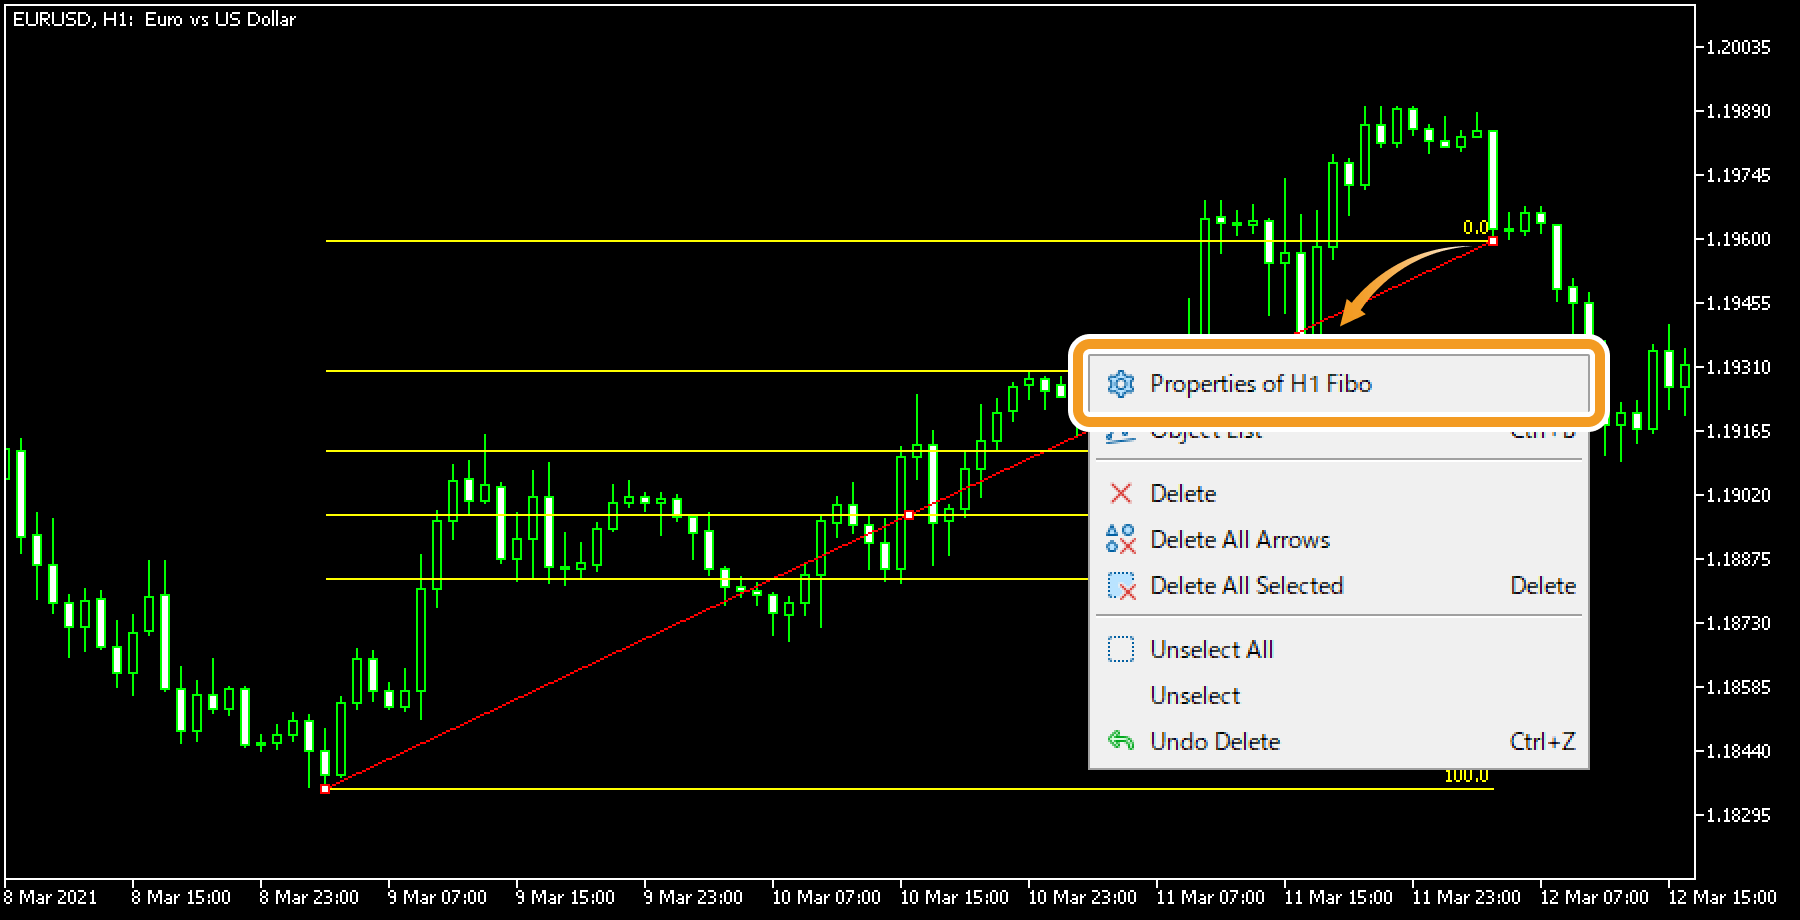
To modify the Fibonacci retracement settings, right-click on the line connecting the starting and end points and select "Fibo properties...".
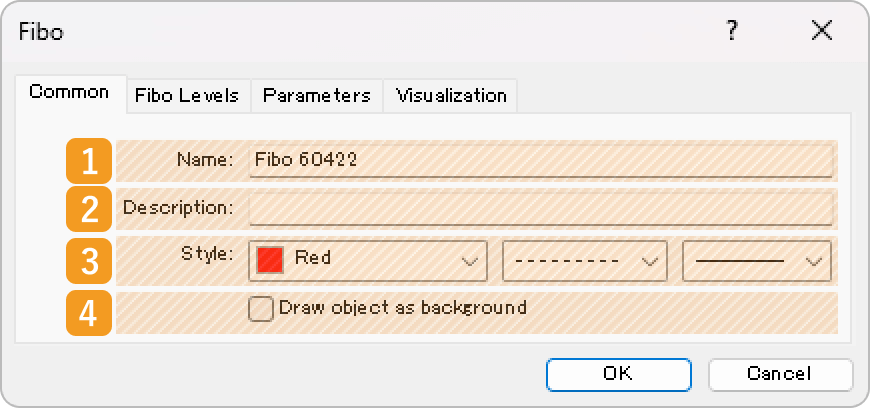
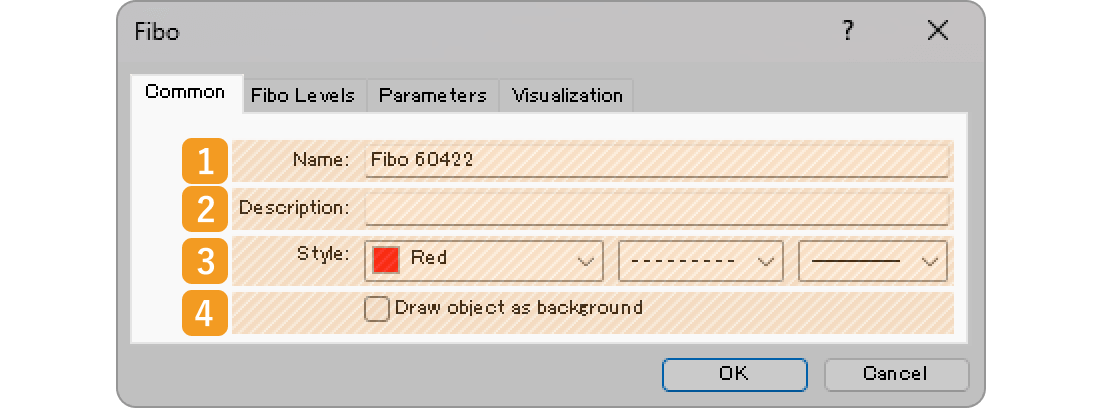
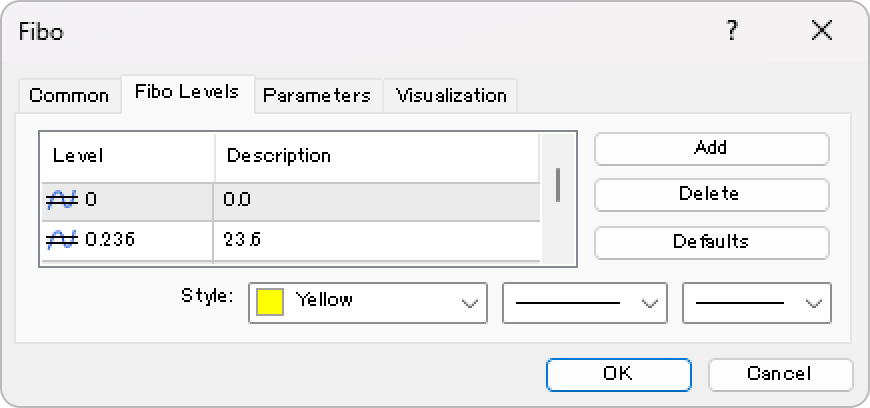
On the "Properties" window, edit the parameters in the "Common", "Fibo Levels", "Parameters", and "Visualization" tabs and click "OK".
|
Number |
Item name |
Descriptions |
|---|---|---|
|
1 |
Name |
Name the Fibonacci retracement. |
|
2 |
Description |
The description can be displayed on the chart when hovering the pointer over the Fibonacci retracement. |
|
3 |
Style |
Set the color, line type, and line thickness for the Fibonacci retracement. |
|
4 |
Draw object as background |
Check this box if you want to place the Fibonacci retracement behind the chart. |
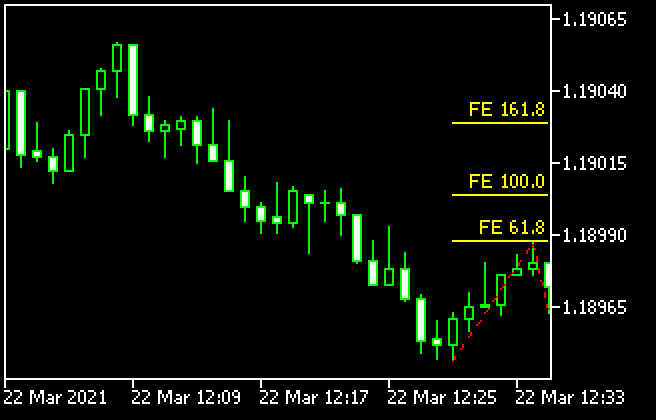
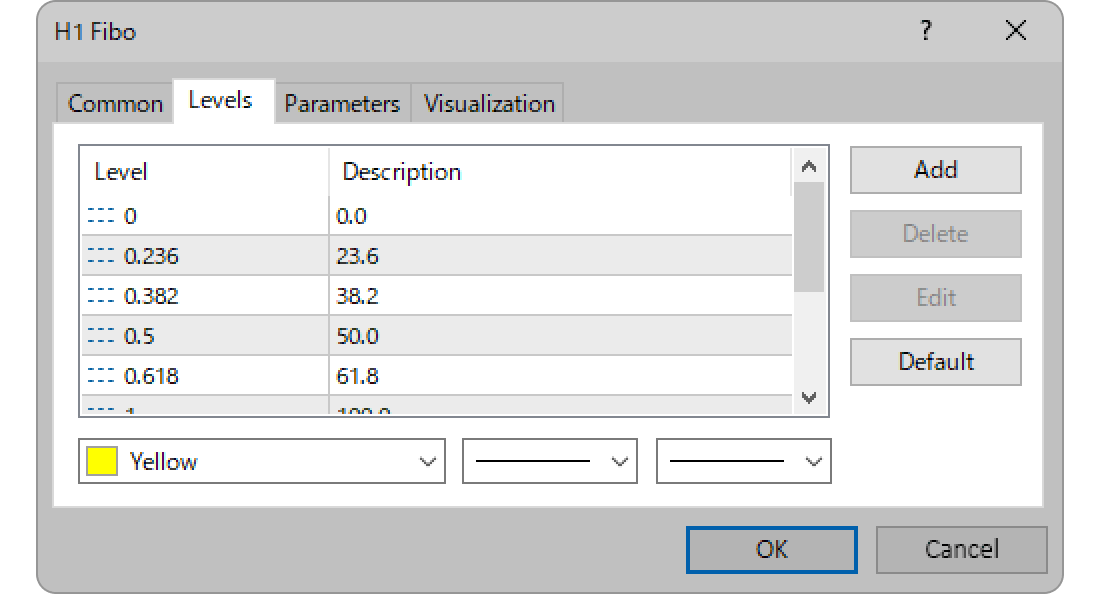
The Fibonacci retracement uses the Fibonacci ratio and draws lines at the 0%, 23.6%, 38.2%, 50%, 61.8%, 100%, 161.8%, 261.8%, and 423.6% marks. If you wish to change these numbers, double-click the number and enter your own value. If you wish to add a line, click "Add" and set the level and description.
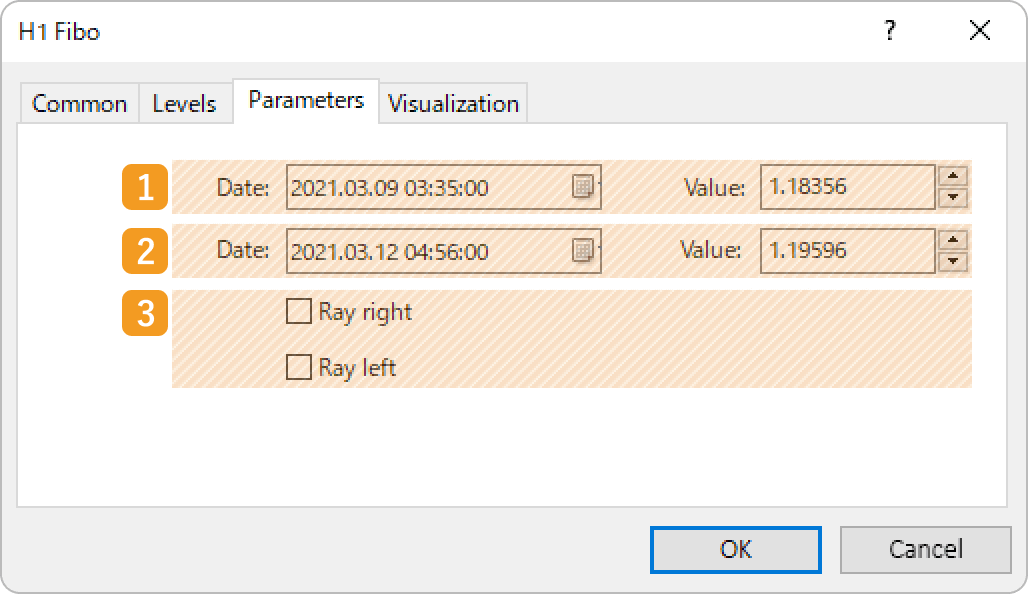
|
Number |
Item name |
Descriptions |
|---|---|---|
|
1 |
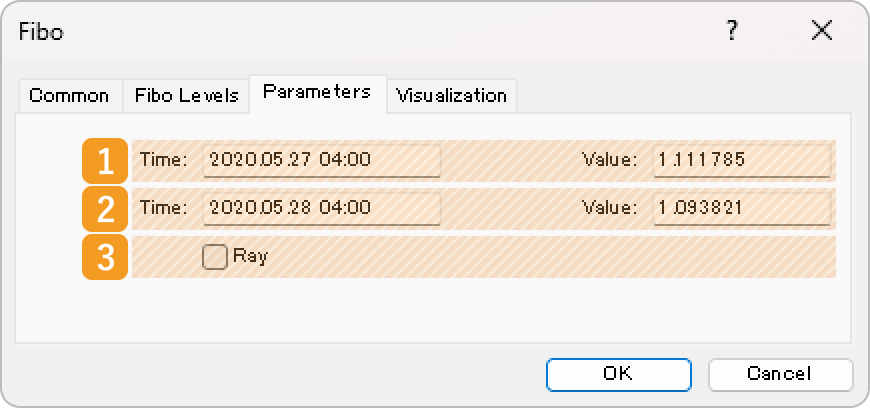
Starting point position |
Specify the starting point position by date and price. |
|
2 |
End point position |
Specify the end point position by date and price. |
|
3 |
Ray |
Check this box to extend the Fibonacci retracement to the right. |

If you check the "Ray" box, the line will be extended beyond its end point. This makes it easier to analyze, as the line will be extended into the future, based on the price movement between the starting point and the end point at a certain point in time.
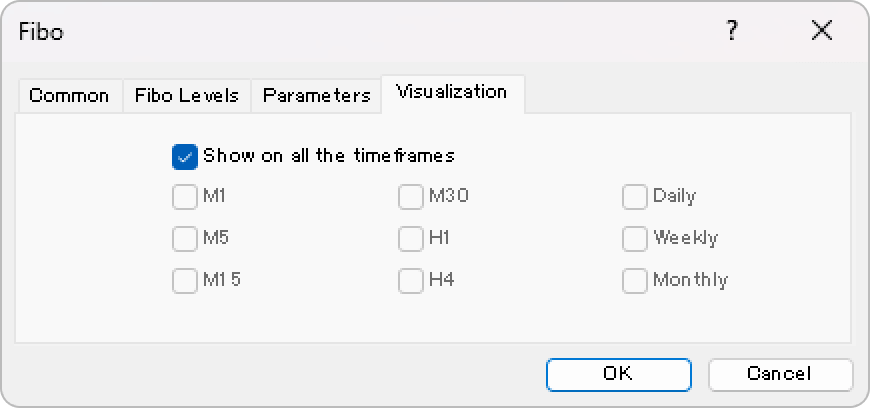
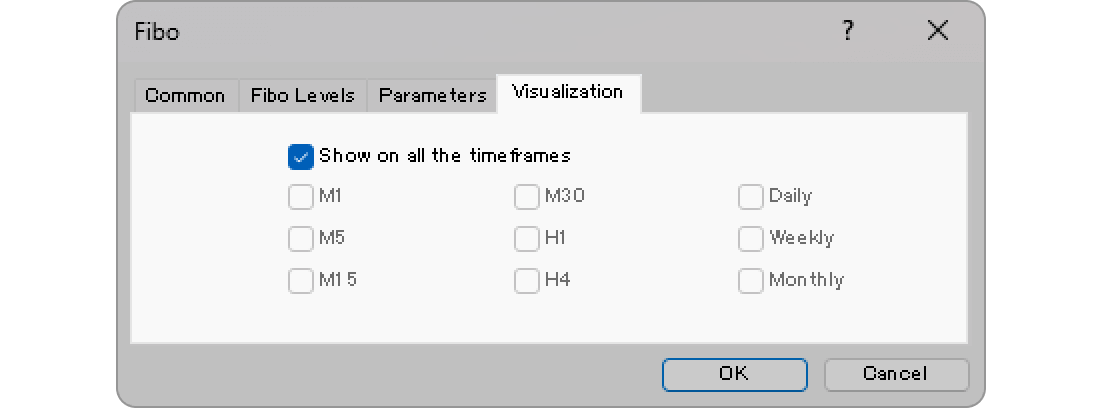
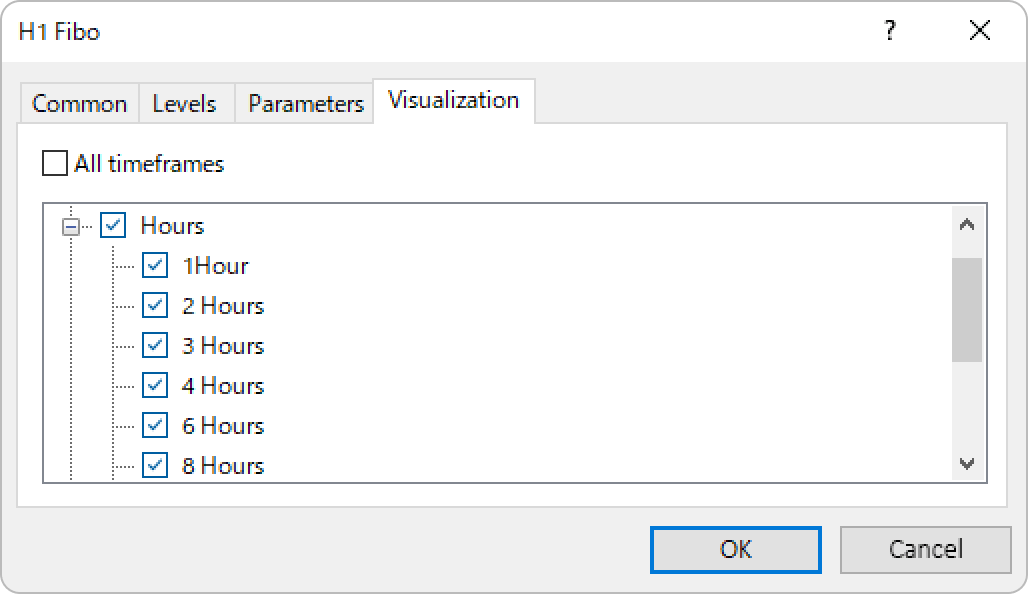
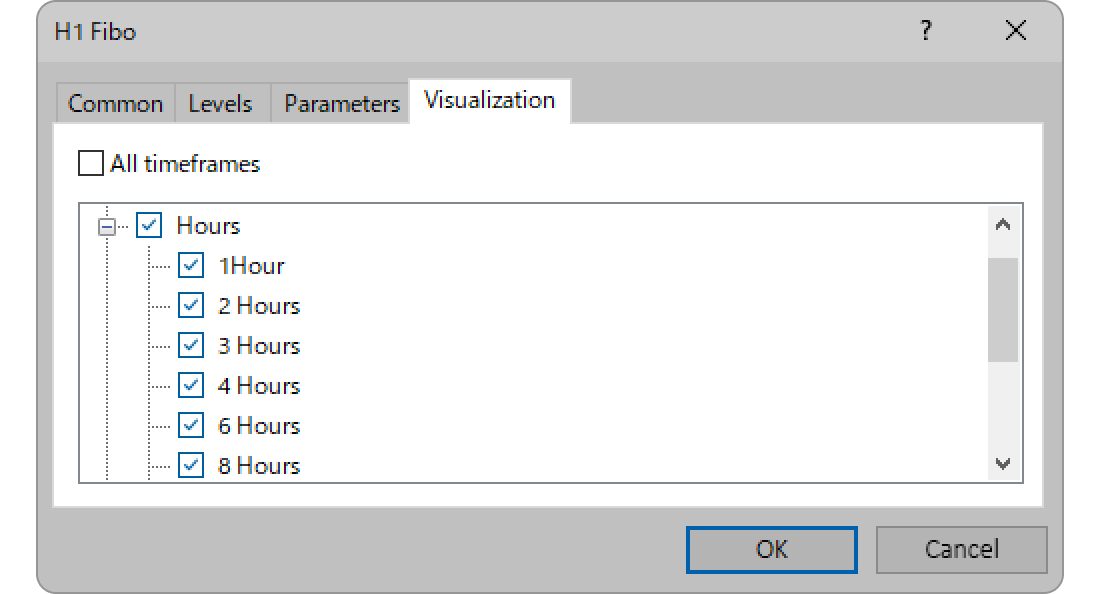
On the "Visualization" tab, you can specify the timeframes to use the Fibonacci retracement with.
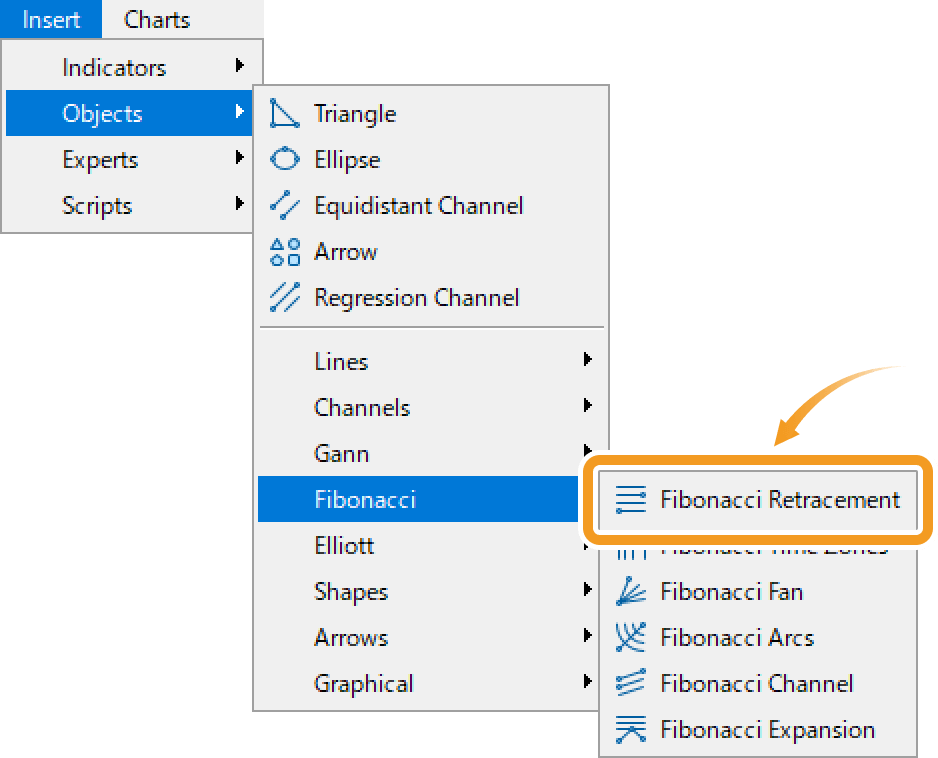
Fibonacci retracement is available from the menu or the Toolbar.
Click "Insert" in the menu. Hover the pointer over "Objects" > "Fibonacci" and select "Fibonacci Retracement".
Click the "Draw Fibonacci retracement" button in the toolbar.
Fibonacci retracement

Fibonacci retracement is a technical indicator that determines the temporary retrace price. It uses the Fibonacci ratio on the gap between the high and low to determine the dip/rally.
Fibonacci time zones
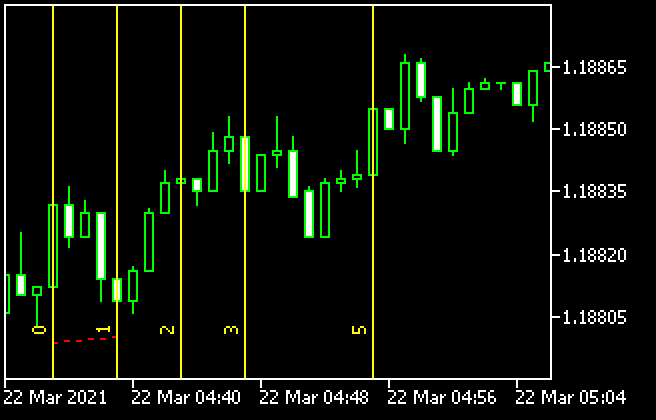

Fibonacci time zones draw vertical Fibonacci lines relative to the time axis. Use these as reference points to determine when the trend will change.
Fibonacci fan

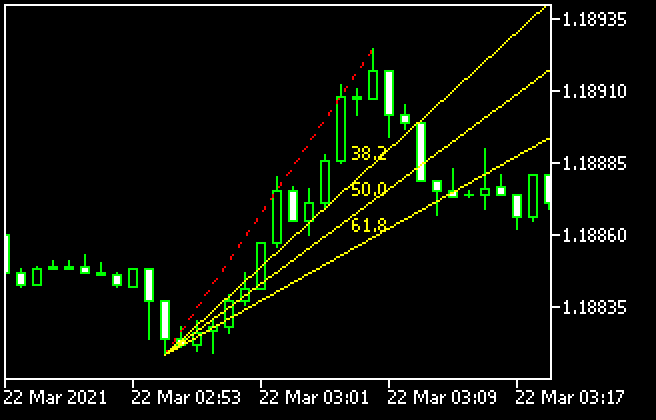
Fibonacci fan plots a wave between the selected starting and end points and three trendline at different Fibonacci ratio. Use these lines as references to determine the support line and resistance line.
Fibonacci arcs
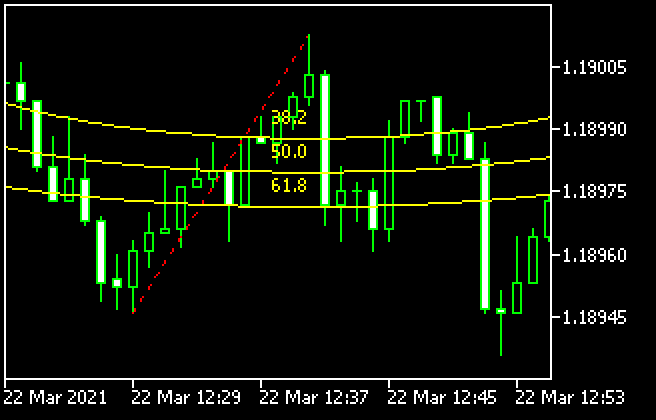

Fibonacci arc is a technical indicator that utilizes the Fibonacci ratio on the price gap and time. Connect the high and low and it will draw 3 arcs relative to the end point using the Fibonacci ratio. Use these lines as reference points to determine the support line and resistance line.
Fibonacci channel
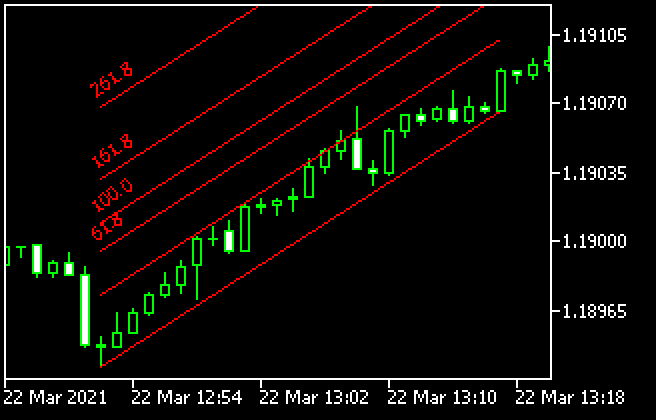

Fibonacci channel uses the trendline and creates parallel channel lines using the Fibonacci ratio. Use these lines as reference points to determine the break points and when the trend will change.
Fibonacci expansion

Fibonacci expansion is a technical indicator that determines how long a trend will last. Connect the starting point of the trend and the dip/rally points and it will draw horizontal lines using the Fibonacci ratio. Use these as reference points to determine how far the market will expand.
Click the starting point on the chart and drag it to the end point to create the Fibonacci retracement.
If you want to adjust the position of the Fibonacci retracement, make sure the white dots are being displayed on the Fibonacci retracement and move each dot as necessary. If you cannot see the white dots, double-click near the Fibonacci retracement to display the white dots.
|
Number |
Descriptions |
|---|---|
|
1 |
Change the starting point of the Fibonacci retracement. |
|
2 |
Change the position of the Fibonacci retracement. |
|
3 |
Change the end point of the Fibonacci retracement. |
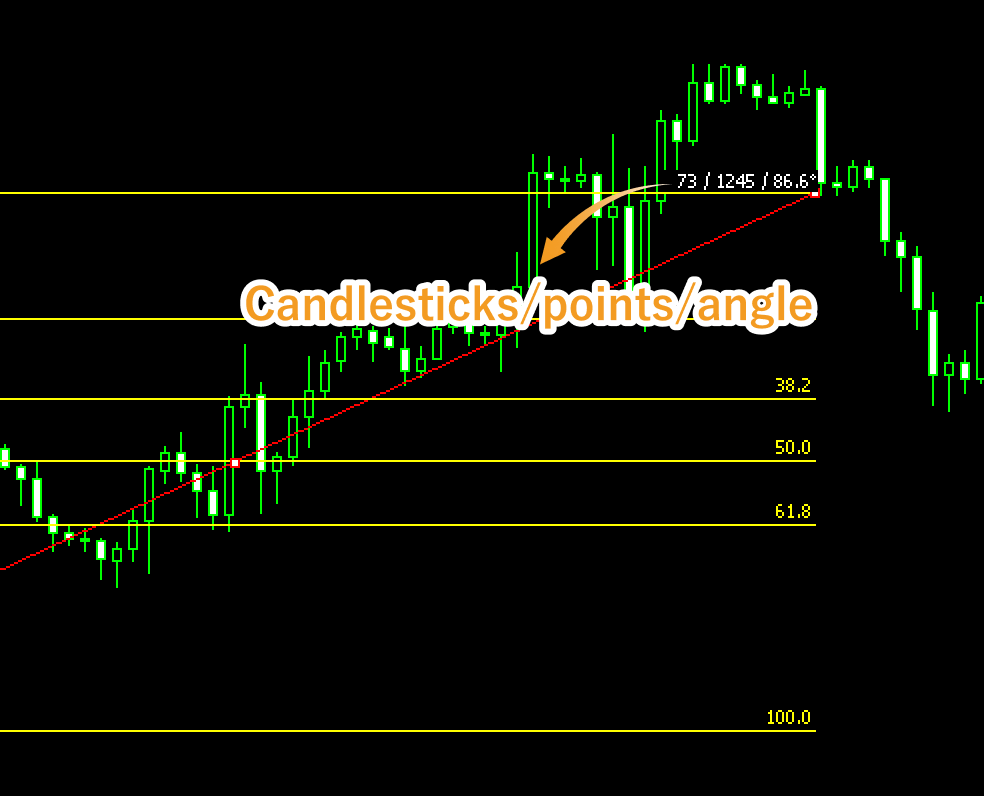
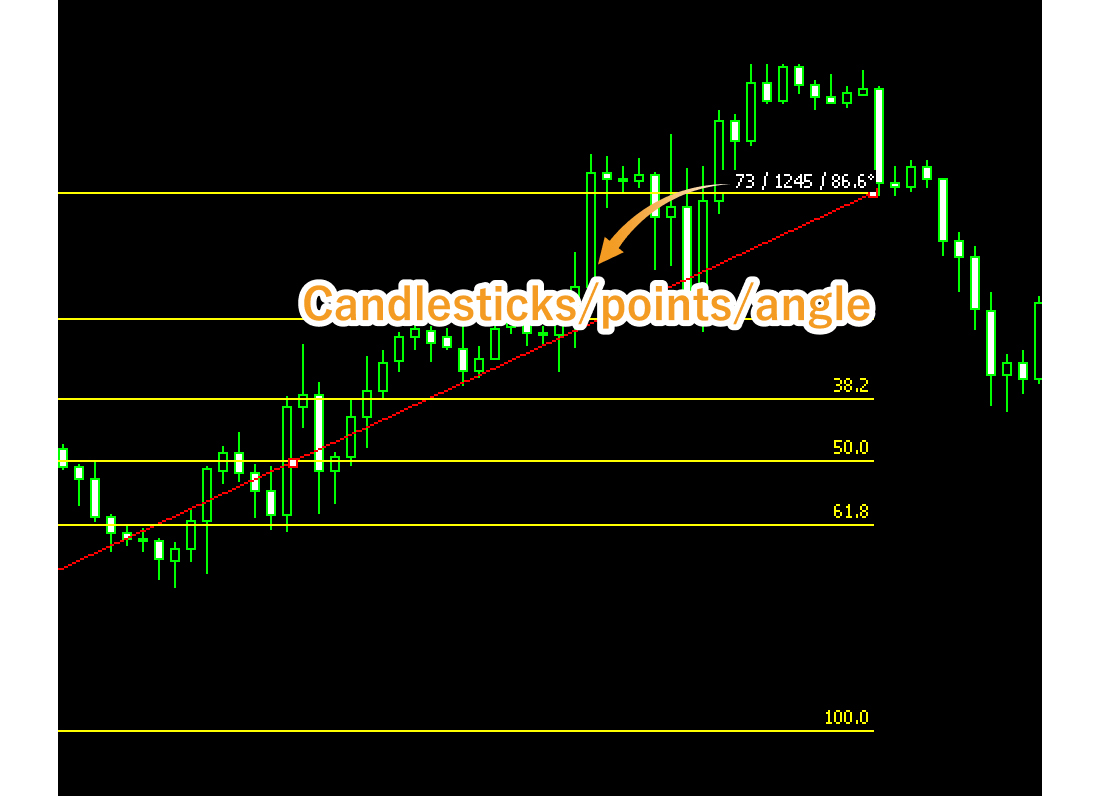
Values displayed when dragging indicate the numbers of candlesticks and points from the starting point to the end point.
To modify the Fibonacci retracement settings, right-click near the Fibonacci retracement and select "Properties of (Fibonacci name)".
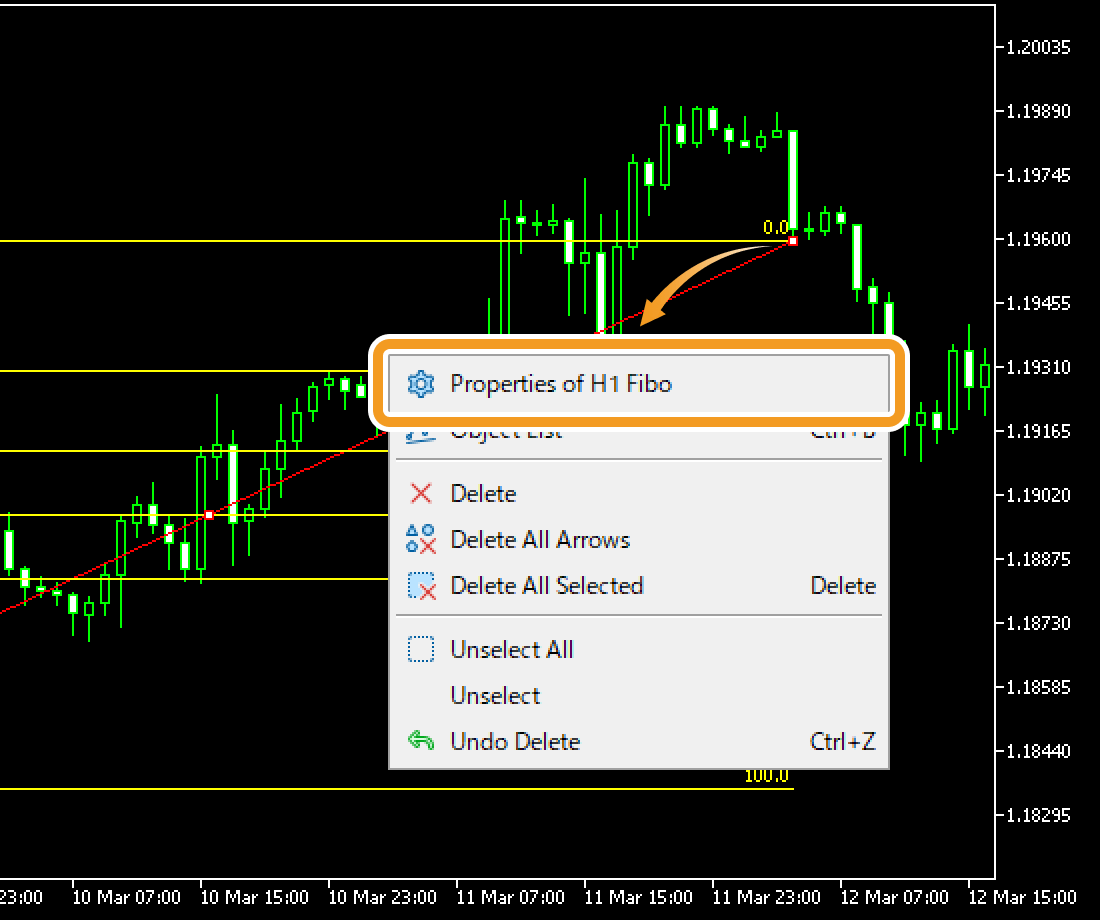
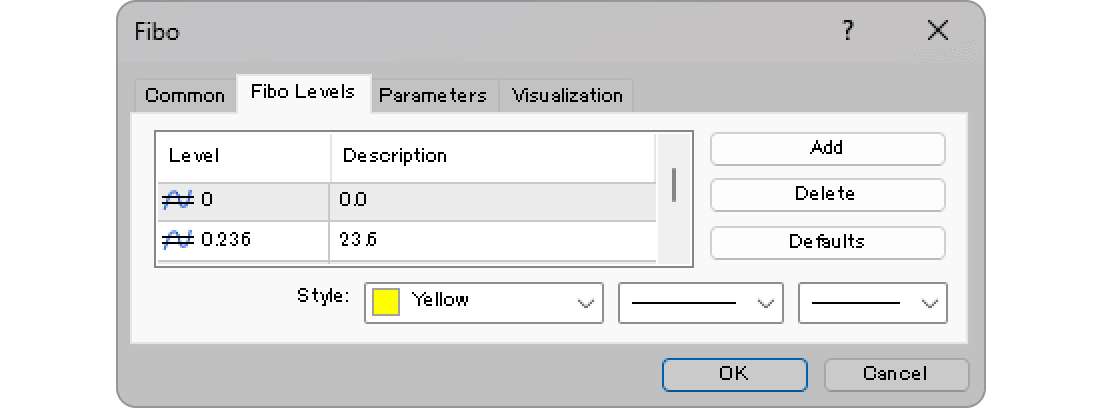
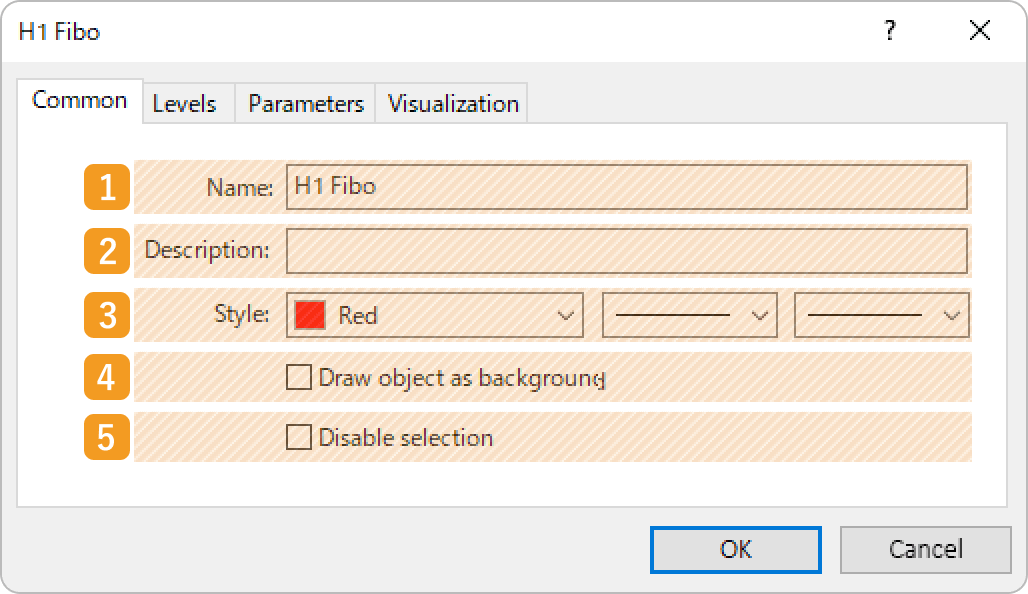
On the "Properties" window, edit the parameters in the "Common", "Levels", "Parameters", and "Visualization" tabs and click "OK".
|
Number |
Item name |
Descriptions |
|---|---|---|
|
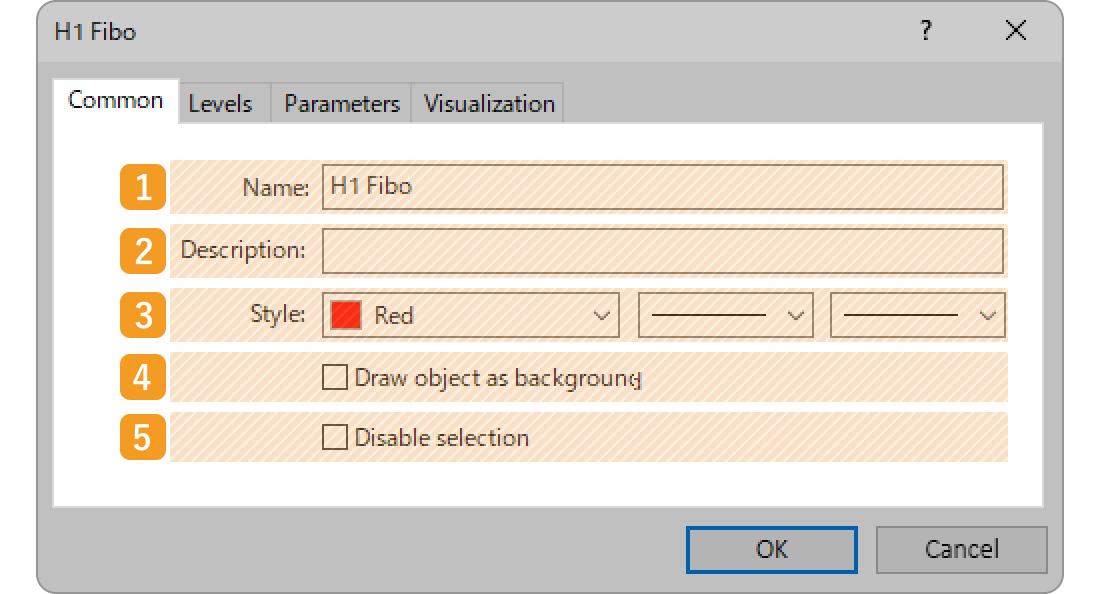
1 |
Name |
Name the Fibonacci retracement. |
|
2 |
Description |
The description of the Fibonacci retracement can be displayed on the chart. |
|
3 |
Style |
Set the color, line type, and line thickness for the Fibonacci retracement. |
|
4 |
Draw object as background |
Check this box if you want to place the Fibonacci retracement behind the chart. |
|
5 |
Disable selection |
Check this box if you want to disable the editing of the Fibonacci retracement. |
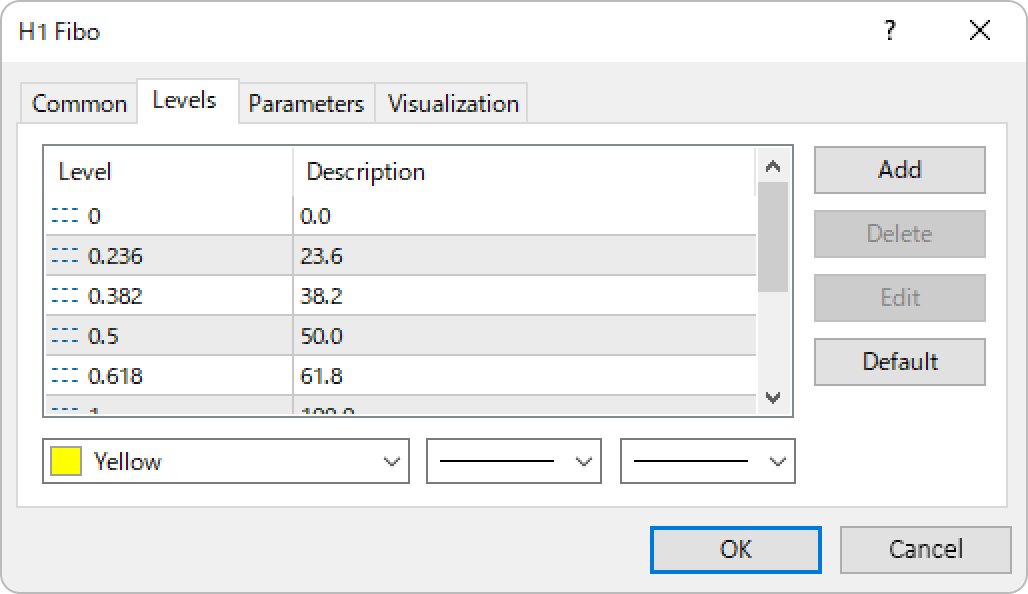
The Fibonacci retracement uses the Fibonacci ratio and draws lines at the 0%, 23.6%, 38.2%, 50%, 61.8%, 100%, 161.8%, 261.8%, and 423.6% marks. If you wish to change these lines, double-click the level and enter your own value. If you wish to add a line, click "Add" and adjust the level/settings.
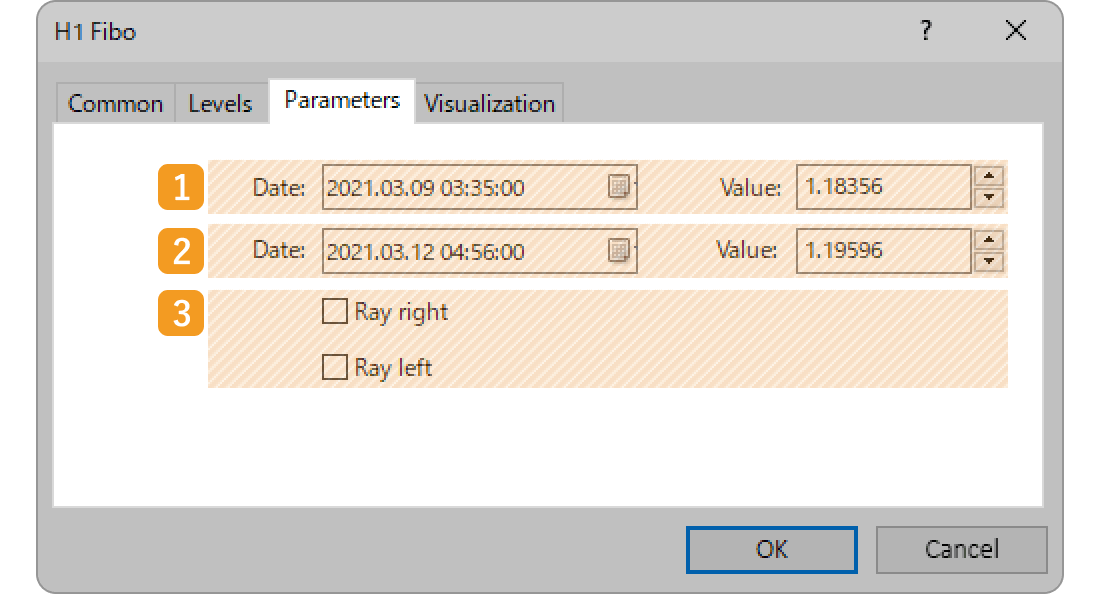
|
Number |
Item name |
Descriptions |
|---|---|---|
|
1 |
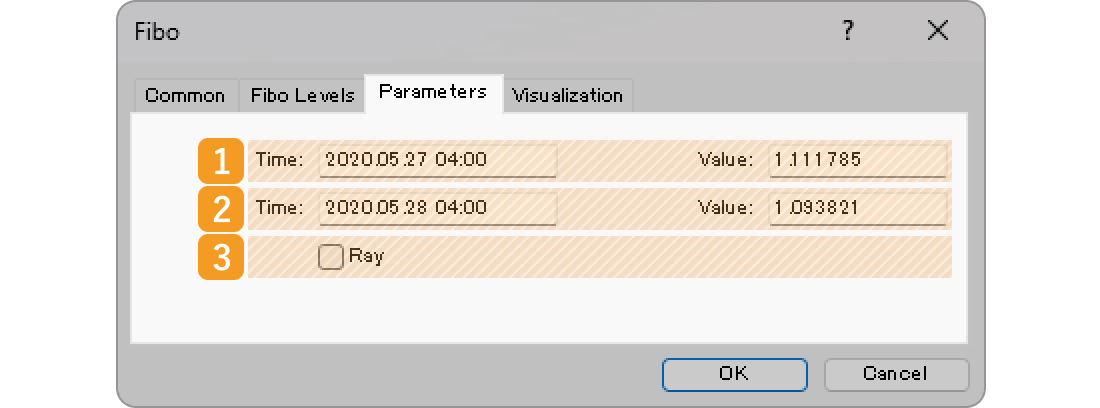
Starting point position |
Specify the starting point position by date and price. |
|
2 |
End point position |
Specify the end point position by date and price. |
|
3 |
Ray |
Check each box to extend the Fibonacci retracement to the left and right. |


If you check the "Ray" box, the line will be extended beyond its end point. This makes it easier to analyze, as the line will be extended into the future, based on the price movement between the starting point and the end point at a certain point in time.
On the "Visualization" tab, you can specify the timeframes to use the Fibonacci retracement with.
![]()
Created
: 2022.09.09
![]()
Last updated
: 2026.03.25

Nakamaru is a manual production consultant at FINTECS, a company that specializes in creating manuals for their clients.
With a wide range of experience from fintech to entertainment, he presents what user-friendly manuals should be like.
He works with numerous large corporations as an external manual production project manager.
【Business information】
http://www.fintecs.co.jp/profile/
Akira Takagi
Systems engineer, MetaTrader administrator

After graduating from Computer Science at the Uninove, Brazil, in 2014, he has worked on various systems development projects.
He participated as a developer in the launch of forex services in 2019. Since then, he has also been involved in the development of MetaTrader plugins and APIs. He is certified by MetaQuotes as a MetaTrader5 Administrator and active in consulting and advisory as well.
We hope you find this article useful. Any comments or suggestions will be greatly appreciated.
We are also looking for writers with extensive experience in forex and crypto to join us.
please contact us at [email protected].

MT4/MT5: Modify EA/indicator settings
![]() 2025.11.05
2025.11.05
![]() 2026.07.09
2026.07.09
On MetaTrader 4 (MT4) / MetaTrader 5 (MT5), you can customize the settings of Expert Advisors (EAs) and indicators applied to charts, supporting your trading strategy or visual preferences.

MT4/MT5: Create or load EA/indicator settings file
![]() 2025.10.06
2025.10.06
![]() 2026.07.09
2026.07.09
In MetaTrader 4 (MT4) and MetaTrader 5 (MT5), you can create or load a settings file to save and reuse your customized parameters. This helps save time each time you apply EAs and indicators to a chart.

MT4/MT5: Install custom indicator
![]() 2023.03.17
2023.03.17
![]() 2026.07.08
2026.07.08
On MT4/MT5, you can install indicators of your choice aside from the pre-installed technical indicators. The indicators installed by users are called custom indicators.

MT4/MT5: Backtest Expert Advisor (EA)
![]() 2022.10.28
2022.10.28
![]() 2026.07.05
2026.07.05
You can perform backtests on automated trading programs known as Expert Advisor (EA) using MT4/MT5's Strategy Tester feature. Here we will look at how to perform Expert Advisor (EA) backtests on MT4/MT5.

MT4/MT5: Save Expert Advisor (EA) testing report
![]() 2022.10.28
2022.10.28
![]() 2026.07.08
2026.07.08
Here we will look at how to save an Expert Advisor (EA) testing report on MT4/MT5. With MT4/MT5's Strategy Tester feature, you can save a result of the Expert Advisor (EA) backtest.
MT4/MT5: Install Expert Advisor (EA)
![]() 2022.10.19
2022.10.19
![]() 2026.07.09
2026.07.09
To use a third-party Expert Advisor (EA), you must first install it on MT4/MT5. Save the Expert Advisor (EA) files to the "Experts" folder of MT4/MT5, and restart MT4/MT5 to complete the installation.
Disclaimer:![]()
All information and content provided on this website is provided for informational purposes only and is not intended to solicit any investment. Although all efforts are made in order to ensure that the information is correct, no guarantee is provided for the accuracy of any content on this website. Any decision made shall be the responsibility of the investor and Myforex does not take any responsibility whatsoever regarding the use of any information provided herein.
The copyright in our content belongs to us.
We welcome your use of our content within appropriate limits, including use through our sharing features, sharing on social media, and quotation. However, please refrain from unauthorized reuse, including but not limited to commercial use, reproduction with modification of content, or reproduction on websites that compete with us. We may take necessary measures, including but not limited to deletion of the relevant content, if we consider that the content has been used in an inappropriate or unauthorized manner.
Myforex uses cookies to improve the convenience and functionality of this website. This website may include cookies not only by us but also by third parties (advertisers, log analysts, etc.) for the purpose of tracking the activities of users. Cookie policy
