


Created
: 2022.07.12


With MetaTrader4 (MT4) / MetaTrader5 (MT5), you can check the tick charts from the Market Watch or when placing a new order. A tick is the smallest unit of data that represents price. And a tick chart shows the price fluctuation in ticks. Tick charts detect price movement faster than any other chart, so it's often used for short-term trading such as scalping (a trading strategy in which traders profit off small price changes).
Here, we'll take a look at how to use and customize the tick charts in the Market Watch screen.
Switch between MT4/MT5 tabs to check the steps for each.
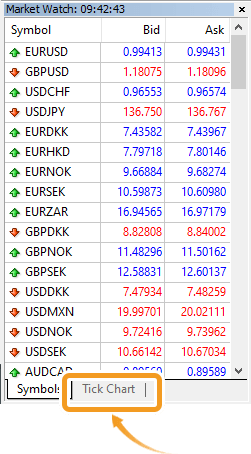
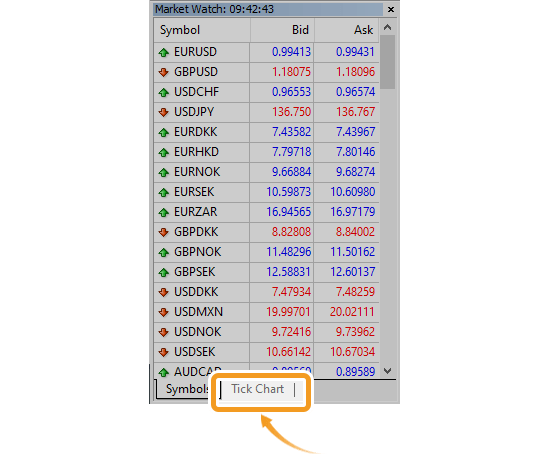
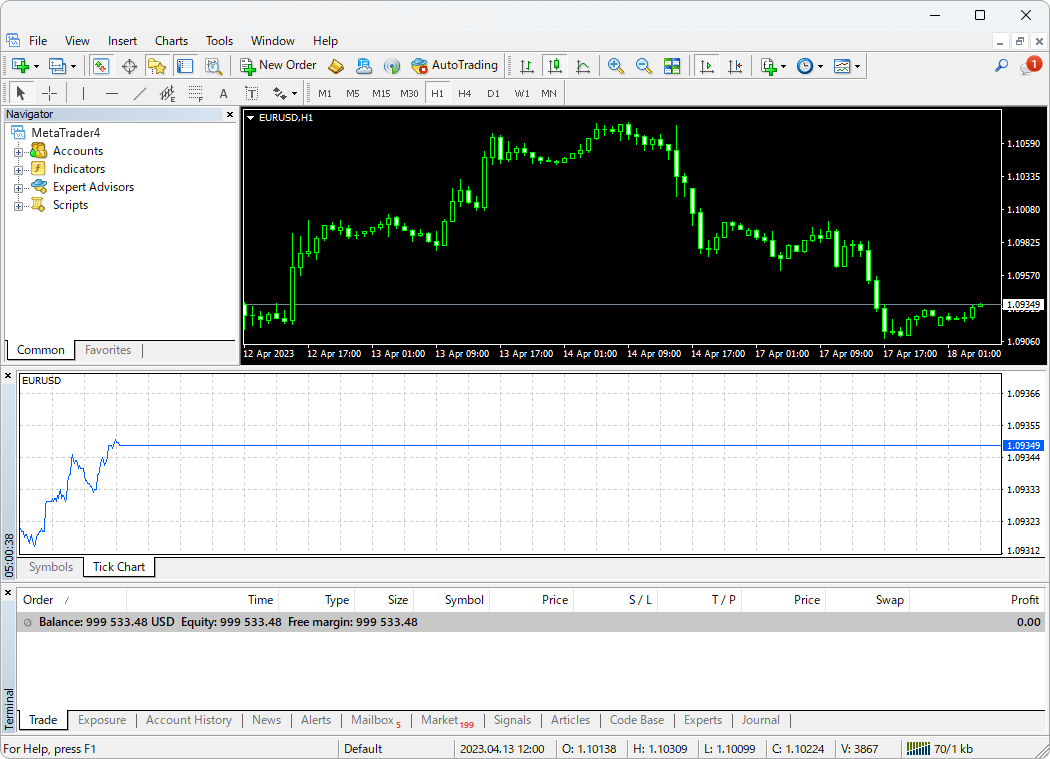
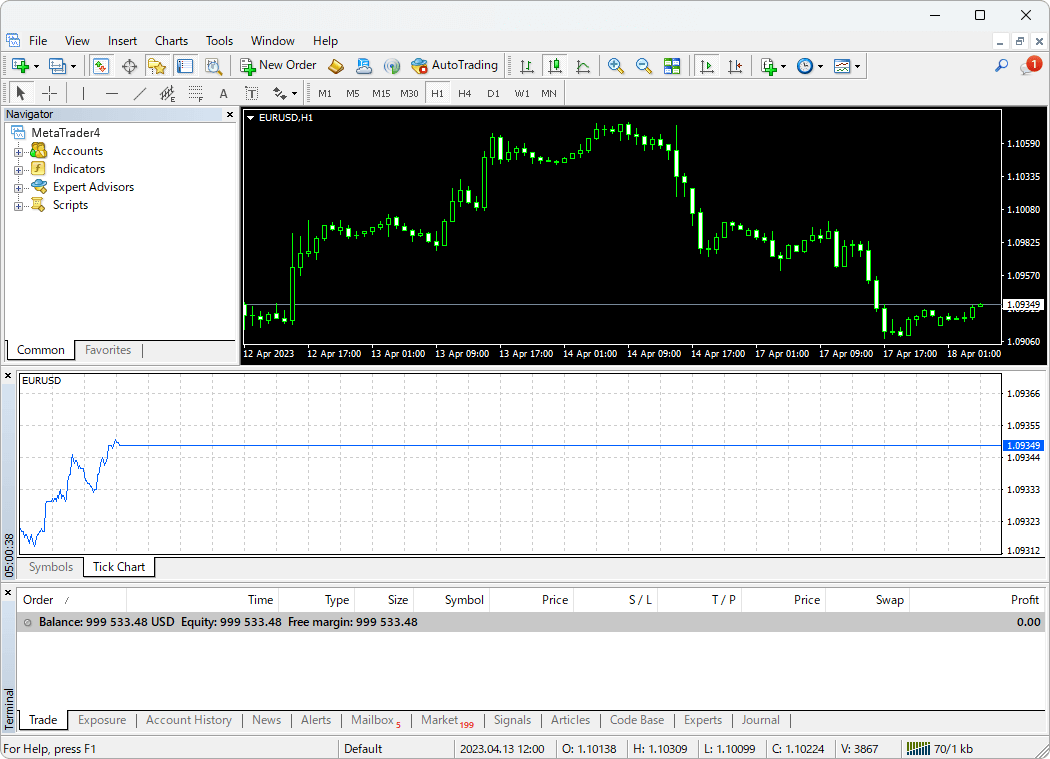
In the "Symbols" tab of the Markets Watch, click the symbol for which you wish to display a tick chart, and switch to the "Tick Chart" tab.
Related article: Manage symbols in Market Watch
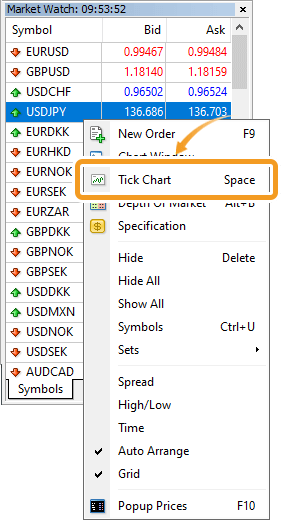
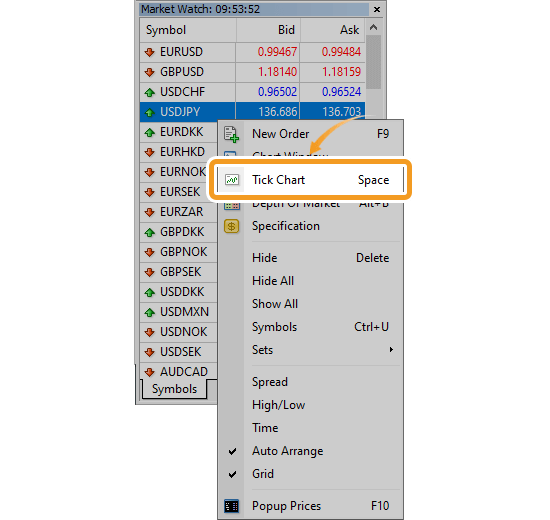
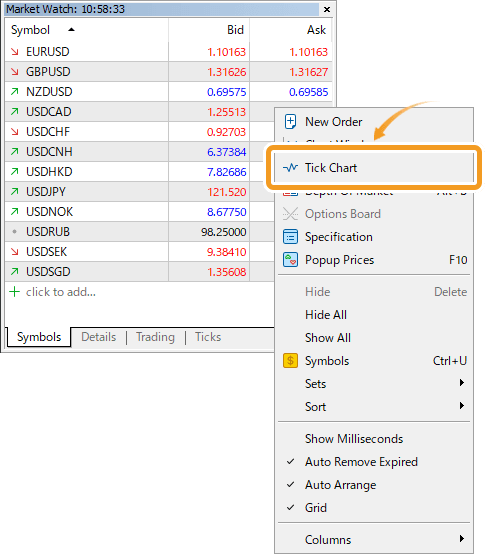
Or, in the "Symbols" tab of the Market Watch, right-click the symbol for which you wish to display the tick chart and select "Tick Chart".
For stocks and other instruments traded on exchanges, a high volume indicates that they are traded actively. Meanwhile, in the case of forex, the market is decentralized, which means that the trading volume cannot be measured. Therefore, tick volume, the number of price movements, is used as a substitute for trading volume assuming that the higher the tick volume, the more active the market is.
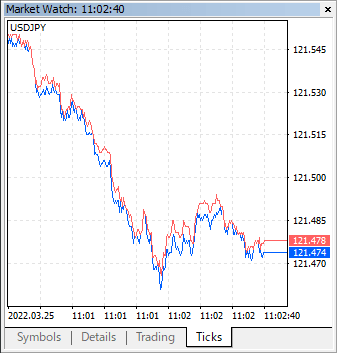
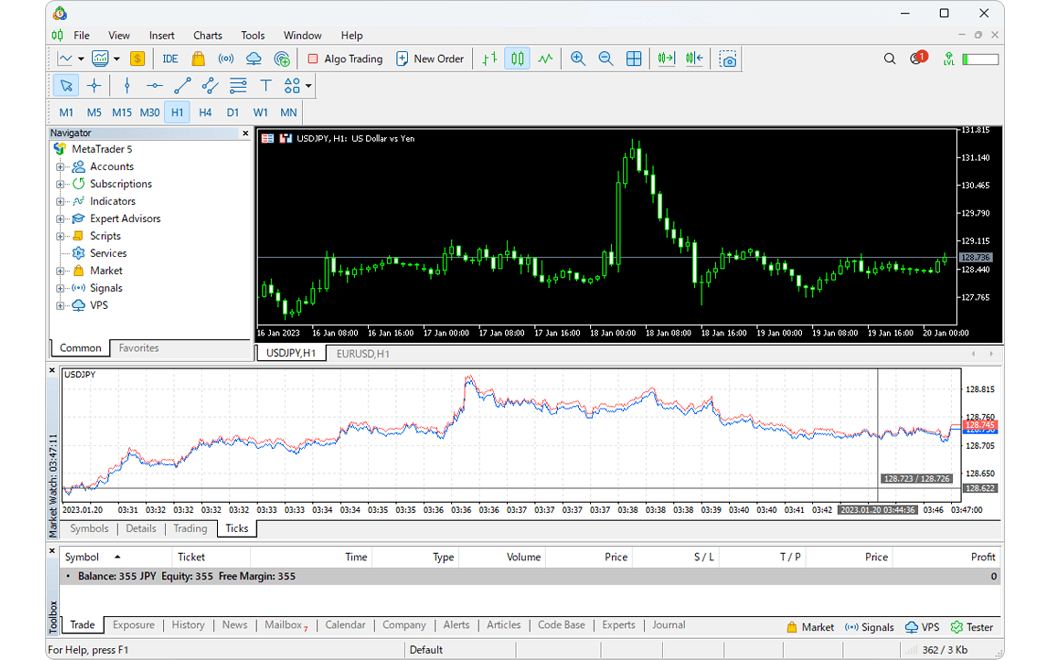
The tick chart for the symbol of your choice will be displayed in the Market Watch.
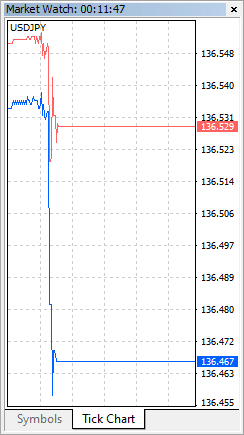
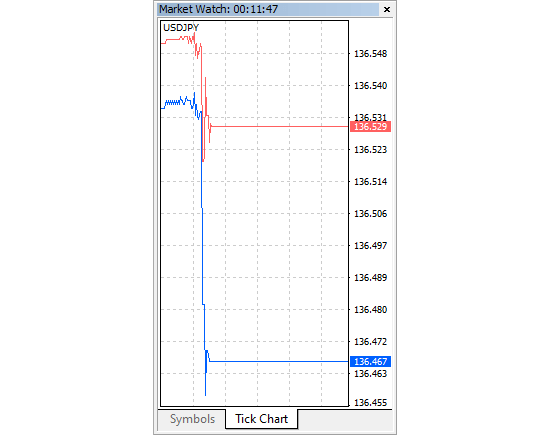
You can change the shape and position of the Market Watch window as you prefer. Placing the tick chart right below the main chart facilitates finding entry points.
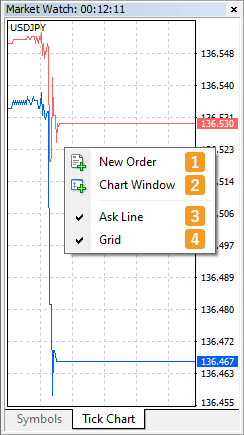
To set up the tick chart, right-click on it and select the item you want to configure from the context menu.
|
Number |
Item name |
Description |
|---|---|---|
|
1 |
New Order |
Display the new order window. |
|
2 |
Chart Window |
Display the chart for the symbol. |
|
3 |
Ask Line |
Show/hide the Ask price line (red) on the tick chart. |
|
4 |
Grid |
Show/hide gridlines on the tick chart. |
In the "Symbols" tab of the Markets Watch, click the symbol for which you wish to display a tick chart, and switch to the "Ticks" tab.
Related article: Manage symbols in Market Watch
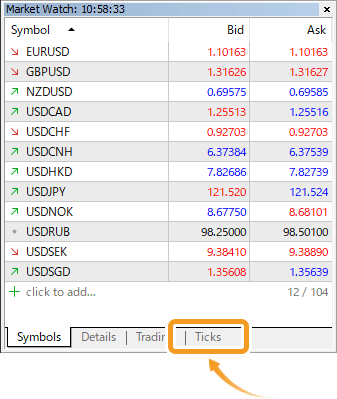
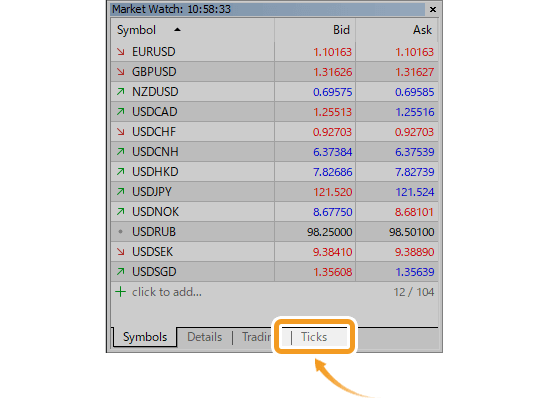
Or, right-click the symbol for which you wish to display the tick chart and select "Tick Chart".
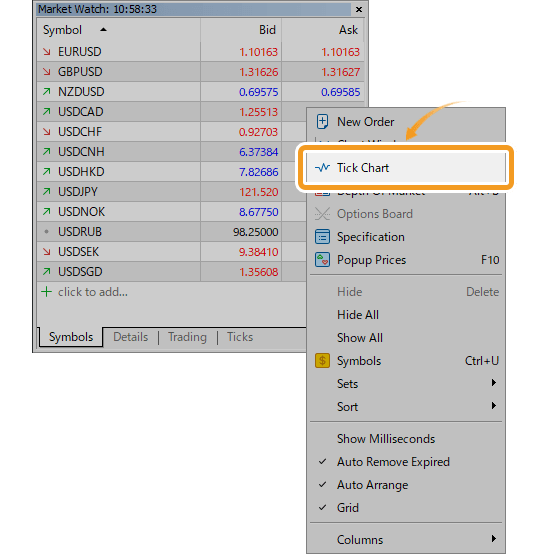
For stocks and other instruments traded on exchanges, a high volume indicates that they are traded actively. Meanwhile, in the case of forex, the market is decentralized, which means that the trading volume cannot be measured. Therefore, tick volume, the number of price movements, is used as a substitute for trading volume assuming that the higher the tick volume, the more active the market is.
The tick chart for the symbol of your choice will be displayed in the Market Watch.
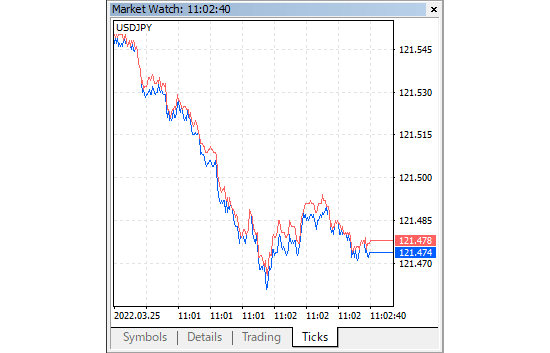
You can change the shape and position of the Market Watch window as you prefer. Placing the tick chart right below the main chart facilitates finding entry points.

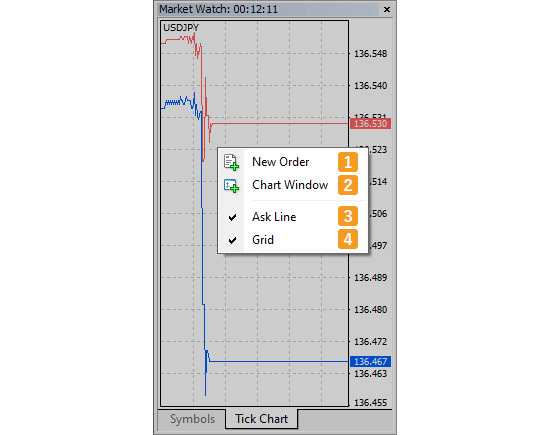
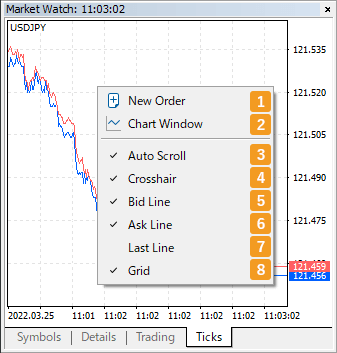
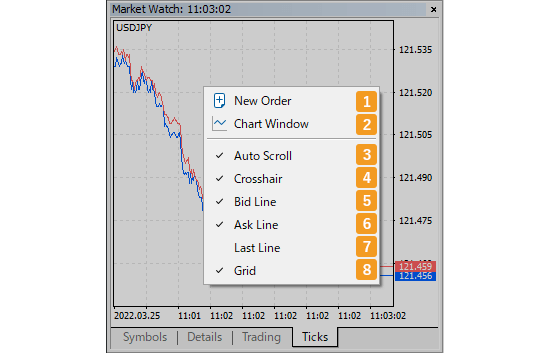
To set up the tick chart, right-click on it and select the item you want to configure from the context menu.
|
Number |
Item name |
Description |
|---|---|---|
|
1 |
New Order |
Display a new order window. |
|
2 |
Chart Window |
Display the chart for the symbol. |
|
3 |
Auto Scroll |
Enable/disable the auto scroll for the tick chart. |
|
4 |
Crosshair |
Show/hide the crosshair on the tick chart. You can check the Bid/Ask prices at a specific time by moving it on the chart. |
|
5 |
Bid Line |
Show/hide the Bid price (blue) on the tick chart. |
|
6 |
Ask Line |
Show/hide the Ask price (red) on the tick chart. |
|
7 |
Last Line |
Show/hide the last traded price (light green). If the broker doesn't provide the last price, it won't be displayed regardless of this setting. |
|
8 |
Grid |
Show/hide gridlines on the tick chart. |
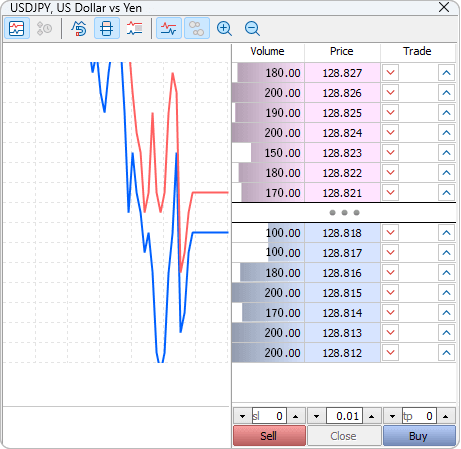
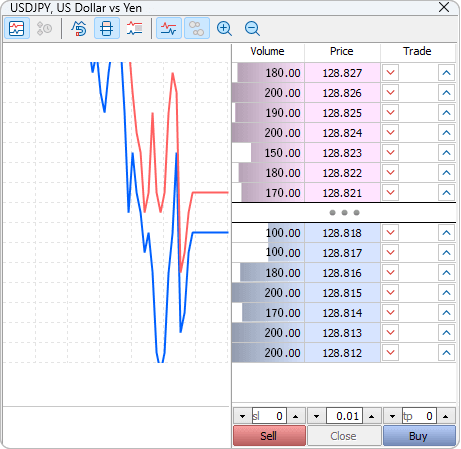
On MT5, the Depth of Market window also shows the tick chart. Although the number of brokers providing the depth of mark data is limited, the Depth of Market window is also useful as a scalping tool.
![]()
Created
: 2022.07.12
![]()
Last updated
: 2026.03.18

Nakamaru is a manual production consultant at FINTECS, a company that specializes in creating manuals for their clients.
With a wide range of experience from fintech to entertainment, he presents what user-friendly manuals should be like.
He works with numerous large corporations as an external manual production project manager.
【Business information】
http://www.fintecs.co.jp/profile/
Akira Takagi
Systems engineer, MetaTrader administrator

After graduating from Computer Science at the Uninove, Brazil, in 2014, he has worked on various systems development projects.
He participated as a developer in the launch of forex services in 2019. Since then, he has also been involved in the development of MetaTrader plugins and APIs. He is certified by MetaQuotes as a MetaTrader5 Administrator and active in consulting and advisory as well.
We hope you find this article useful. Any comments or suggestions will be greatly appreciated.
We are also looking for writers with extensive experience in forex and crypto to join us.
please contact us at [email protected].
MT4/MT5: Compile EA/indicator
![]() 2025.10.15
2025.10.15
![]() 2026.06.19
2026.06.19
In MetaTrader 4 (MT4) / MetaTrader 5 (MT5), you need to compile the EA/indicator source code before running it. Here we will look at how to compile EAs and indicators on MT4/MT5.

MT4/MT5: Manage columns in Market Watch
![]() 2022.08.15
2022.08.15
![]() 2026.03.18
2026.03.18
Here we'll take a look at how to change the items displayed on the Market Watch in MT4/MT5. You can get information such as spread, low and high prices, and more in the Symbols tab of the Market Watch on MT4/MT5.
MT4/MT5: Manage symbols in Market Watch
![]() 2022.08.12
2022.08.12
![]() 2026.03.26
2026.03.26
Here we will look at how to manage symbols in the Market Watch on MT4/MT5. On MT4/MT5, you can show or hide not only specific symbols, but also all symbols at once.

MT4/MT5: Open the Popup Prices
![]() 2022.08.10
2022.08.10
![]() 2026.03.25
2026.03.25
Here we will look at how to use the Popup Prices on MT4/MT5. The Popup Prices feature makes it easier to see the information displayed in the Symbols tab in the Market Watch.

MT4/MT5: Adjust window layout
![]() 2022.08.05
2022.08.05
![]() 2026.03.26
2026.03.26
Here we'll take a look at how to adjust the windows layout in MT4/MT5. You can adjust the window layout on MT4/MT5 to your liking.
MT5: Display symbol details in Market Watch
![]() 2022.08.05
2022.08.05
![]() 2026.04.24
2026.04.24
The Market Watch consists of four tabs: Symbols, Details, Trading, and Ticks. In the Details tab, you'll find various information such as close price of the previous day, today's high/low/open, change in price from the previous day, and current price. Here we'll take a look at how to display the details for a symbol on the Market Watch in MetaTrader5 (MT5).
Disclaimer:![]()
All information and content provided on this website is provided for informational purposes only and is not intended to solicit any investment. Although all efforts are made in order to ensure that the information is correct, no guarantee is provided for the accuracy of any content on this website. Any decision made shall be the responsibility of the investor and Myforex does not take any responsibility whatsoever regarding the use of any information provided herein.
The copyright in our content belongs to us.
We welcome your use of our content within appropriate limits, including use through our sharing features, sharing on social media, and quotation. However, please refrain from unauthorized reuse, including but not limited to commercial use, reproduction with modification of content, or reproduction on websites that compete with us. We may take necessary measures, including but not limited to deletion of the relevant content, if we consider that the content has been used in an inappropriate or unauthorized manner.
Myforex uses cookies to improve the convenience and functionality of this website. This website may include cookies not only by us but also by third parties (advertisers, log analysts, etc.) for the purpose of tracking the activities of users. Cookie policy
