
- English
- English
- What's Myforex
- Share
- Use tools
- Get information
- What's New
- Help center
- About us
- Customer support
- Terms and policies


-

-
 Real-time spread comparisonCompare spreads of major retail brokers in real time
 -
 Volatility analysisVisualize volatility as a measure of daily market activity
 -
 Swap point comparisonCompare buy and sell swap values for each broker by symbol
 -
 Market rates & chartsCheck prices for all instruments offered by each broker
 -
 IndicatorsProviding in-house developed indicators for MT4/MT5
 -
 Trading calculatorsCalculation tools for each broker to help you trade


Multi-timeframe Trend Analysis Indicator

Multi-timeframe Trend Analysis Indicator
- Overview
- How to install
- How to set up
Display:


![]()
![]()
![]()
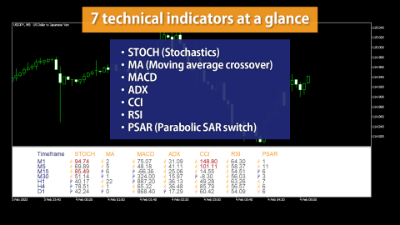
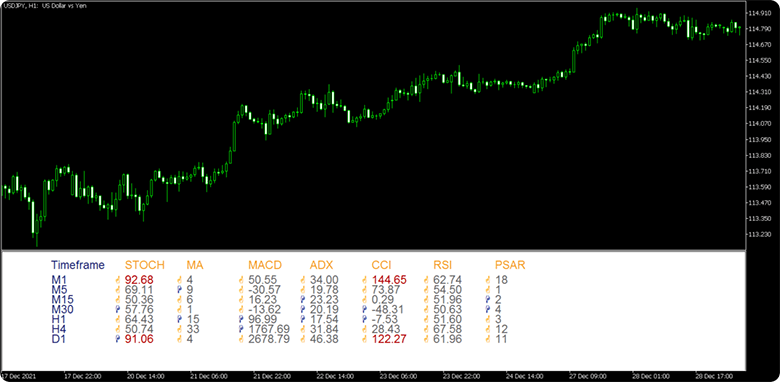
Multi-timeframe trend analysis indicator displays up to 7 technical indicators with different timeframes and symbols on a single chart. From stochastics to MACD, you can check up to 7 trend indicators with different timeframes and symbols simultaneously. The trend of each indicator is shown with an upward or downward finger, helping you grasp the overall trend of the market at a glance.
![]()
![]()
![]()
Features
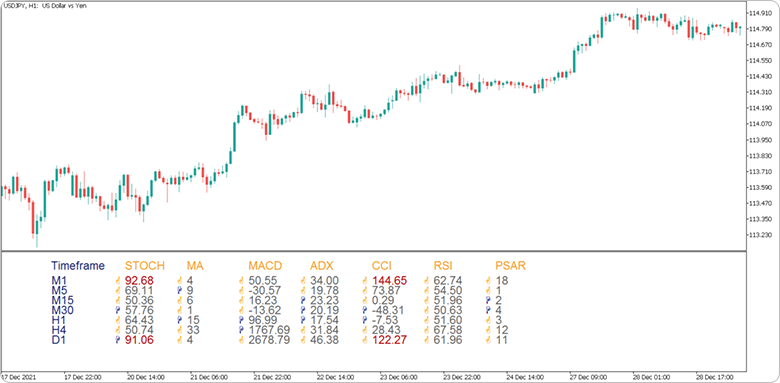
Display 7 technical indicators
Use the multi-timeframe trend analysis indicator to show up to 7 technical indicators with different timeframes and symbols on a single panel.
| Technical indicator | Details |
|---|---|
| STOCH (Stochastics) |
Determines when a symbol has moved into an overbought or oversold position based on high, low, and current price during a certain timeframe. Value of %K is displayed on the panel. |
| MA (Moving average crossover) |
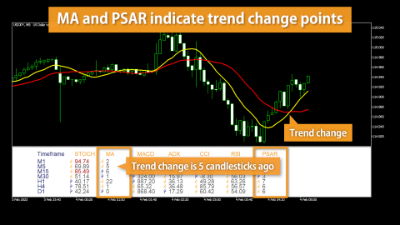
Determines the trend based on the positions of the short and mid term MAs. Value on the panel indicates when the last trend change occurred. |
| MACD | Determines the trend based on the difference between long and short term exponential moving average (EMA). Value of MACD is displayed on the panel. Since the value is often extremely small, the decimal point is moved up 4 places. |
| ADX | Determines the strength of the trend based on high and low prices during a specific timeframe. Value of ADX is displayed on the panel. |
| CCI | Determines if the symbol is overbought or oversold based on "Typical price (TP)", which is the sum of high, low, and closing price divided by 3. Value of CCI is displayed on the panel. |
| RSI | Determines if the symbol is overbought or oversold based on fluctuation during a specific timeframe. Value of RSI is displayed on the panel. |
| PSAR (Parabolic SAR switch) |
Determines the trend using a series of dots. Value on the panel indicates when the last trend change occurred. |
This indicator requires a complicated series of calculations. It may take a few seconds for the values to appear.
Each technical indicator can be turned "ON" and "OFF" from parameter settings to your liking.
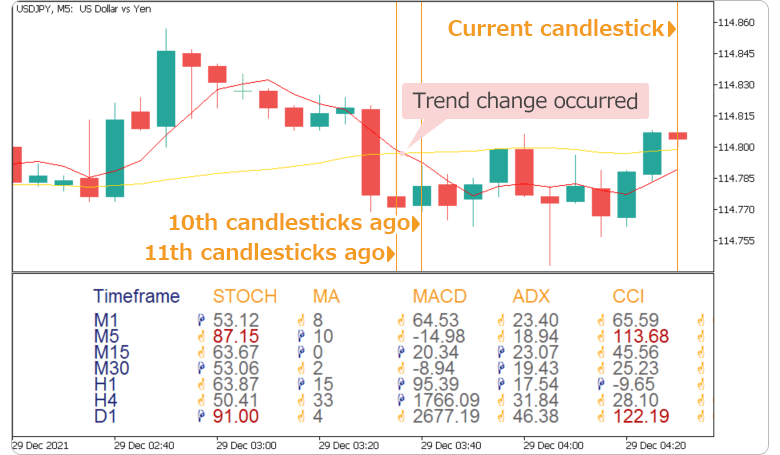
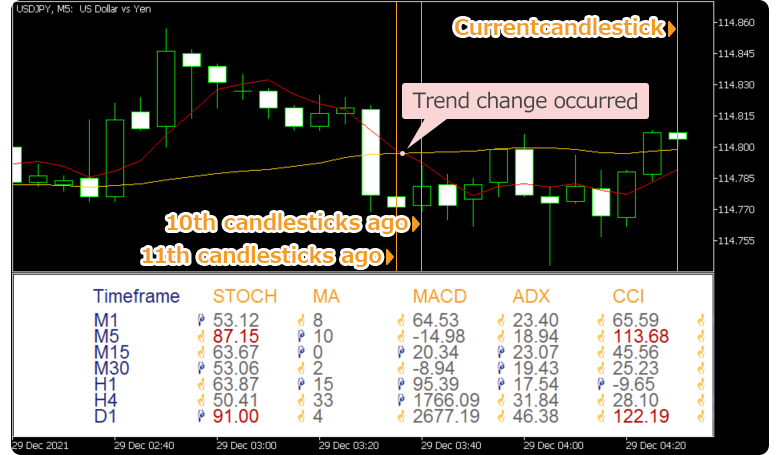
For MA (moving average crossover) and PSAR (parabolic SAR switch), the value displayed indicates when the last trend change occurred, not the indicator itself.
For instance, if MA (moving average crossover) displays a value of "10", it means that the last trend change occurred between the 11th and 10th candlesticks ago.
Adjustable parameters of the multi-timeframe trend analysis indicator are mostly the same as the ones found in MetaTrader5. However, certain parameters such as "Applied price field" cannot be changed.
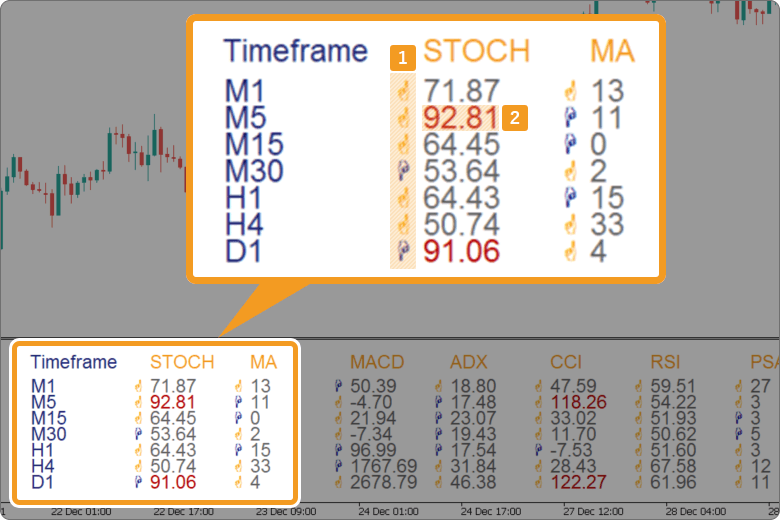
Upward/downward trend signs and analysis mark
In addition to displaying the values of the technical indicators, the tool offers additional features to help you read the market trend.
Number |
Item name |
Description |
|---|---|---|
1 |
Upward/downward trend signs |
Displays an orange and blue finger mark for an upward and downward trend respectively. |
2 |
High/low price levels |
For the 3 technical indicators (stochastics, CCI, RSI), where information on high/low price levels is important, the value is displayed in red whenever it goes over or under a specified value. |
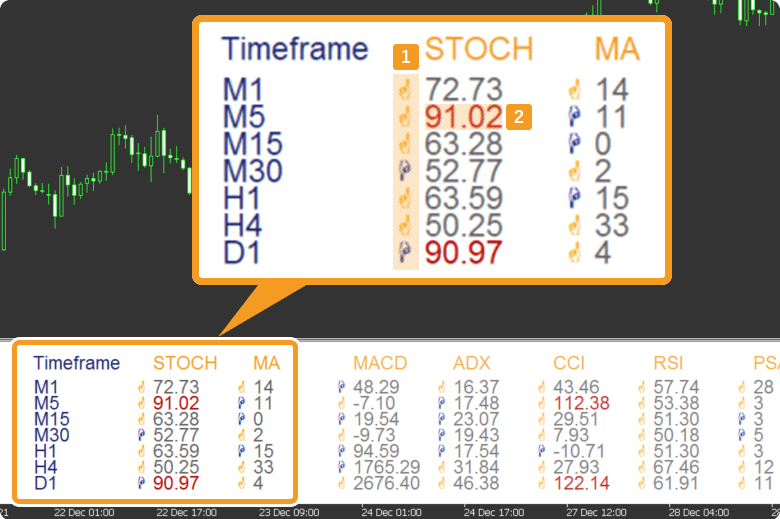
Use these features to detect trend changes across multiple technical indicators so you can take advantage of another opportunity. Anticipate trend changes using high/low price level alerts.
Information regarding high/low price levels, shown in red, is extremely important for oscillators such as CCI and RSI. By default it shows an upward arrow when the value is 0+ and 50+ for CCI and RSI respectively, and a downward arrow in other cases. Beware of trend change when the value is displayed in red, regardless of the color of the arrow.
Upward/downward trend signs and high/low price levels will be displayed when the criteria below are met.
| Technical indicator | Sign display condition |
|---|---|
| STOCH (Stochastics) |
Orange (upward): %K≧%D Blue (downward): %K<%D The value will be shown in red if the current value of %K is either "20 or below" or "80 or above". |
| MA (Moving average crossover) |
Orange (upward): Short-term MA≧Mid-term MA Blue (downward): Short-term MA<Mid-term MA |
| MACD | Orange (upward): MACD≧signal Blue (downward): MACD<signal |
| ADX (ADX crossover) |
Orange (upward): +DI≧-DI Blue (downward): +DI<-DI |
| CCI | Orange (upward): CCI≧0 Blue (downward): CCI<0 The value will be shown in red if the current value of CCI is either "at or above the threshold 1" or "at or below the threshold 2". |
| RSI | Orange (upward): RSI≧50 Blue (downward): RSI<50 The value will be shown in red if the current value of RSI is either "at or above the threshold 1" or "at or below the threshold 2". |
| PSAR (Parabolic SAR switch) |
Orange (upward): Current PSAR<current rate Blue (downward): Current PSAR>current rate |
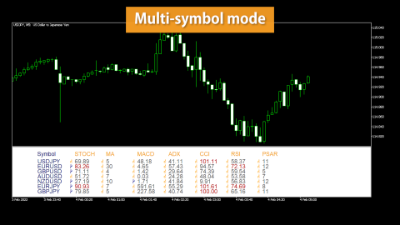
Multi-symbol mode is available
To use the multi-timeframe trend analysis indicator, you can choose from two modes: "multi-timeframe mode" and "multi-symbol mode".
Multi-timeframe mode allows the user to display multiple technical indicators for different time frames on a specified symbol, helping you spot signals spread throughout different time frames.
Multi-symbol mode allows the user to display multiple technical indicators for different symbols on a specified time frame. Useful for when you want to monitor multiple symbols simultaneously.
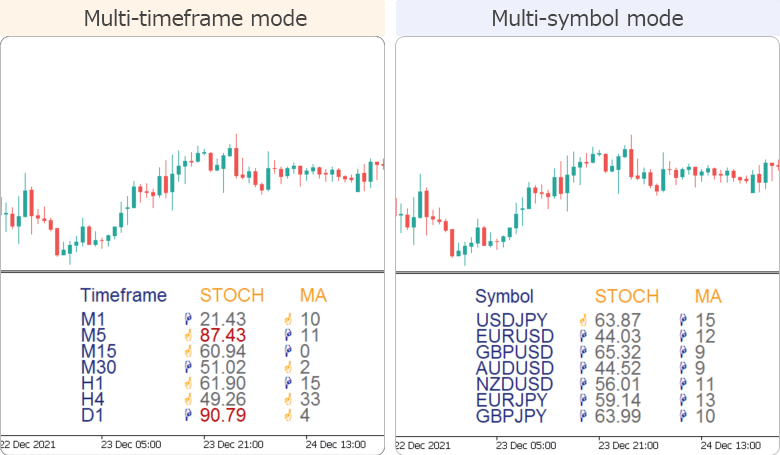
You can select up to 7 different time frames and symbols. If you only need a few, you can adjust the window width to your liking.
Turn the "Automatically adjust window width" to "OFF" if you wish to adjust the width of the sub-window manually. Note that in MetaTrader5, the parameter must be set to "OFF" when applying this indicator to the chart.
Due to technical reasons, you cannot change this parameter afterward in MetaTrader5. If you had the parameter set to "ON" when applying the indicator, you must delete it and start over. Note that this is not the case with MetaTrader4.
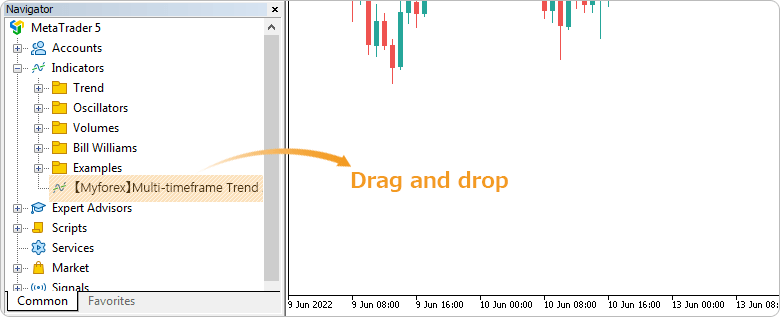
How to install
To use the multi-timeframe trend analysis indicator, install the "【Myforex】Multi-timeframe Trend Analysis Indicator" file on MetaTrader4/MetaTrader5.
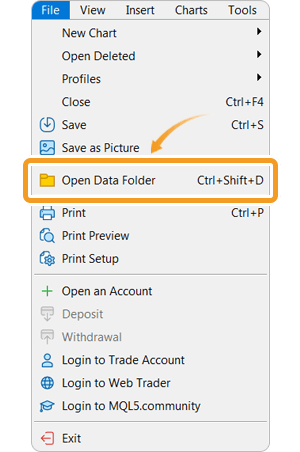
Step 1
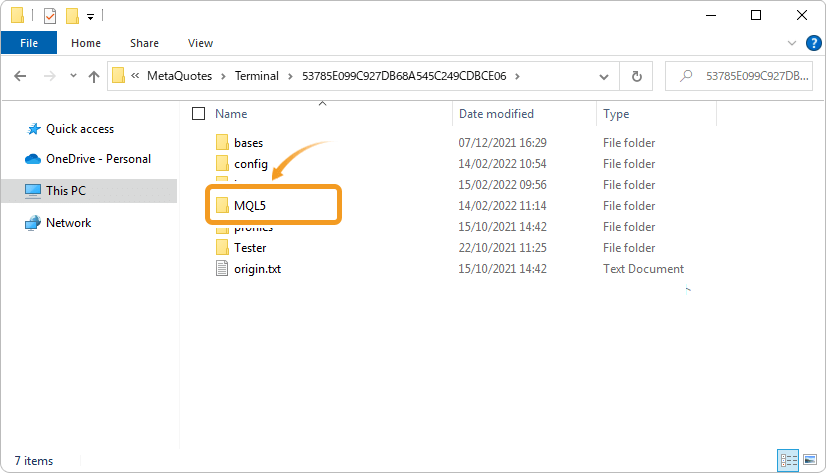
Click "File" from the menu bar at the top of MetaTrader4/MetaTrader5 and choose "Open Data Folder".
Step 2
After opening the data folder, double-click the folder "MQL5 (MQL4 for MetaTrader4)" in it to open it.
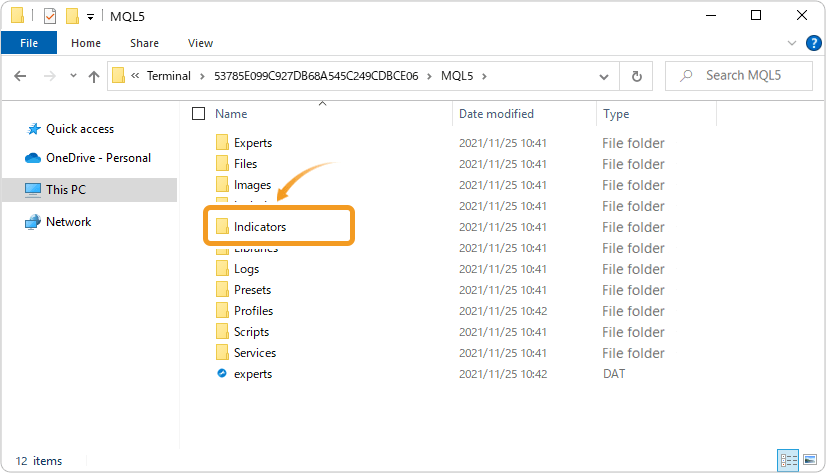
Step 3
Double-click to open "Indicators" folder in the MQL5 file.
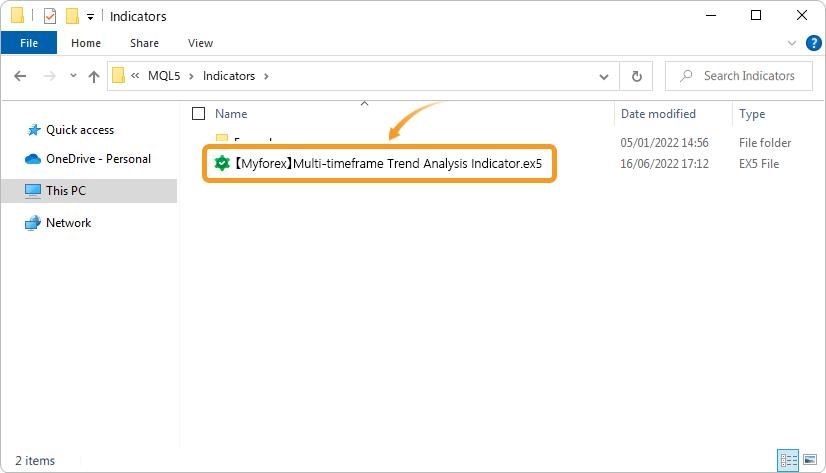
Step 4
Save the "【Myforex】Multi-timeframe Trend Analysis Indicator" in the "Indicators" folder.
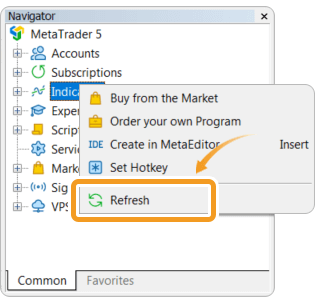
Step 5
Once the file is in the folder, right-click "Indicators" in the Navigator and choose "Refresh" from the displayed menu.
Step 6
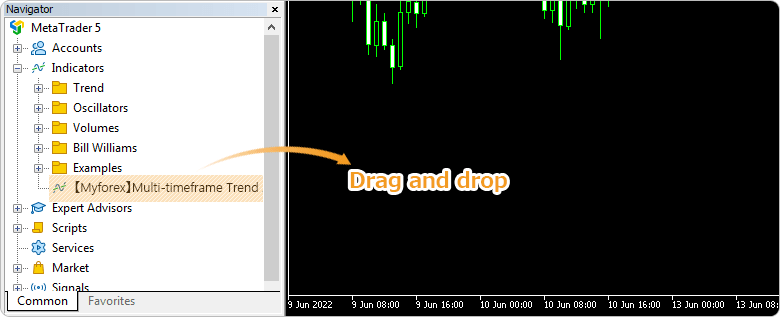
After checking that the multi-timeframe trend analysis indicator is shown in the "Indicators" of the Navigator, apply it to a chart by double-clicking or dragging and dropping.
Step 7
Refer to the "How to set up" page to make further settings in the "Inputs" tab, then click "OK".
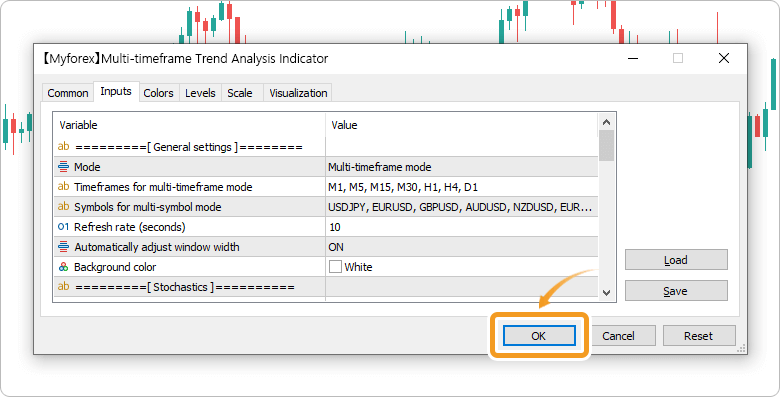
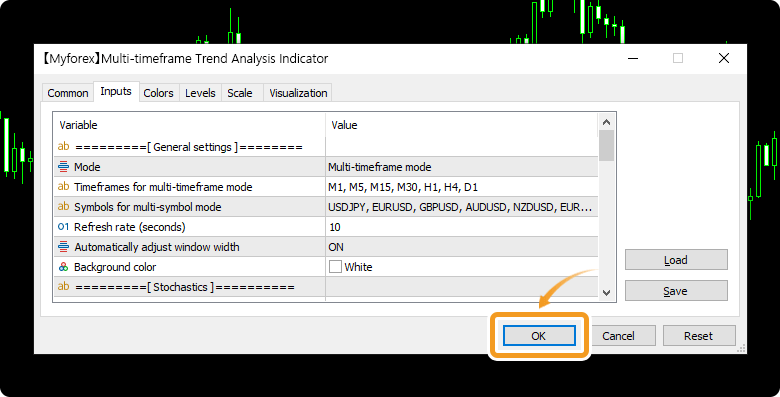
Step 8
The multi-timeframe trend analysis indicator is applied to the chart, and the panel will be displayed.
Multi-timeframe trend analysis indicator is displayed in a sub-window on the chart. If there aren't enough timeframes/symbols, some of them may be hidden. In that case, set the "Automatically adjust window width" to OFF and adjust the size of the sub-window accordingly. Due to technical reasons, you cannot change this parameter afterward in MetaTrader5. If you had the parameter set to "ON" when applying the indicator, you must delete it and start over.
How to set up
After applying the indicator to the chart, set the parameters according to your style.
Step 1
First, open the "Inputs" tab.
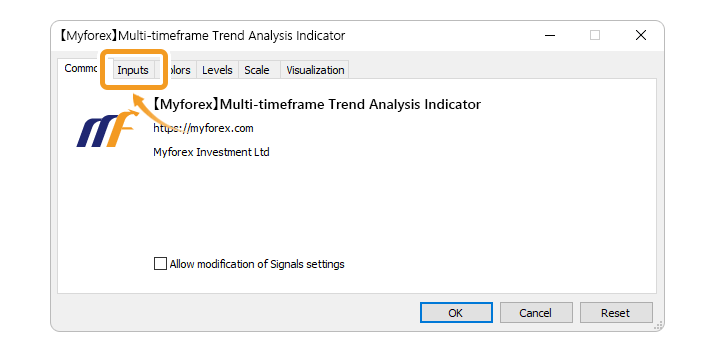
Step 2
Set the parameters as follows.
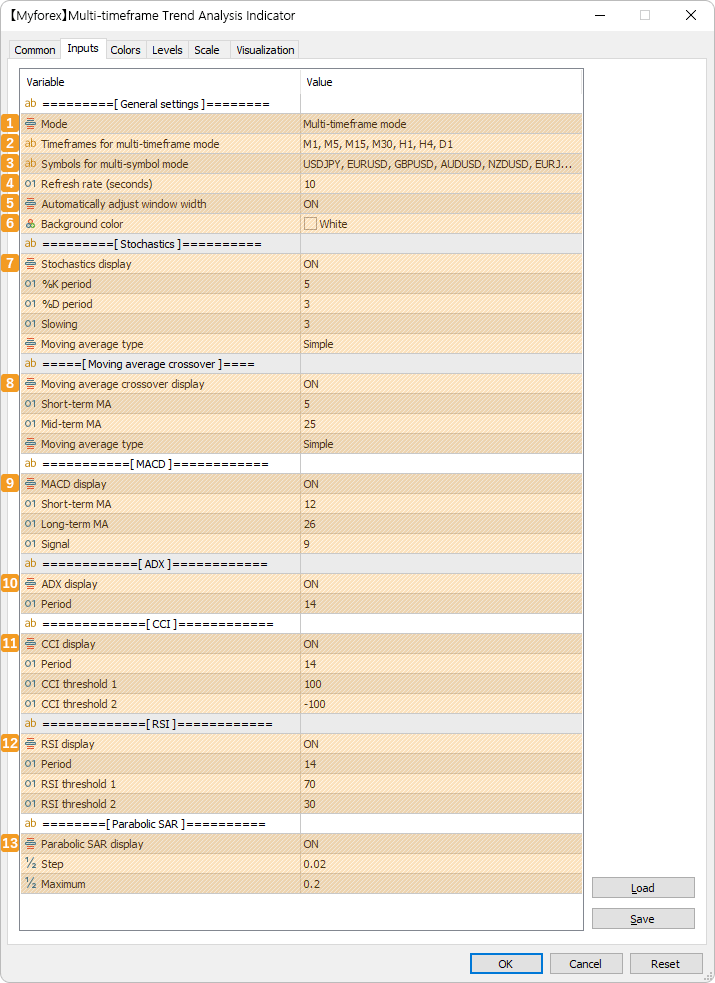
General parameters
Number |
Item name |
Description |
|---|---|---|
1 |
Mode |
Select from "Multi-timeframe mode" or "Multi-symbol mode". |
2 |
Timeframes for multi-timeframe mode |
Enter up to 7 different timeframes to be displayed during the multi-timeframe mode. Separate the desired timeframe by a comma. |
3 |
Symbols for multi-symbol mode |
Enter up to 7 different symbols to be displayed during the multi-symbol mode. Separate the desired symbol by a comma. |
4 |
Refresh rate (seconds) |
Set the refresh rate of the indicators by seconds. |
5 |
Automatically adjust window width |
Turn the feature to automatically adjust the length of the sub-window "ON" or "OFF". If you choose "ON", you won't be able to adjust it manually. |
6 |
Background color |
Set the background color for the panel. |
If you set the "Automatically adjust window width" to "OFF", you can adjust the sub-window width manually. Note that in MetaTrader5, the parameter must be set to "OFF" when applying this indicator to the chart.
Due to technical reasons, you cannot change this parameter afterward in MetaTrader5. If you had the parameter set to "ON" when applying the indicator, you must delete it and start over. Note that this is not the case with MetaTrader4.
Stochastics
Number |
Item name |
Description |
|---|---|---|
7 |
Stochastics display |
Select ON to display the stochastics, or OFF to hide it. "Low/High" is used for "Applied price field". When the current price of %K is either " 20 or less" or "80 or more", the value will be displayed in red as a high/low price level. |
|
%K period |
Set the calculation period for %K. |
|
%D period |
Set the calculation period for %D. |
|
Slowing |
Set the calculation period for slow %D. |
|
Moving average type |
Select the smoothing method to calculate %D. ・Simple:simple moving average |
7 |
|---|
Stochastics display |
|
ストキャスティクスを表示するかを「ON」「OFF」から選択します。「適用価格帯」には「Low/High」が使用されます。%Kの現在値が「20以下」または「80以上」のいずれかの条件を満たした場合、高値圏・安値圏として数値が赤字で表示されます。 |
%K period |
Set the calculation period for %K. |
%D period |
|
Set the calculation period for %D. |
Slowing |
|
Set the calculation period for slow %D. |
Moving average type |
|
Select the smoothing method to calculate %D. ・Simple:simple moving average |
Moving average crossover
Number |
Item name |
Description |
|---|---|---|
8 |
Moving average crossover display |
Select ON to display the moving average crossover, or OFF to hide it. "Close" is used for "Applied price field". |
|
Short-term MA |
Set the calculation period for short-term MA. |
|
Mid-term MA |
Set the calculation period for mid-term MA. |
|
Moving average type |
Select the MA type. ・Simple:simple moving average |
8 |
|---|
Moving average crossover display |
|
Select ON to display the moving average crossover, or OFF to hide it. "Close" is used for "Applied price field". |
Short-term MA |
Set the calculation period for short-term MA. |
Mid-term MA |
|
Set the calculation period for mid-term MA. |
Moving average type |
|
Select the MA type. ・Simple:simple moving average |
MACD
Number |
Item name |
Description |
|---|---|---|
9 |
MACD display |
Select ON to display MACD, or OFF to hide it. "Close" is used for "Applied price field". |
|
Short-term MA |
Set the calculation period for short-term MA. |
|
Long-term MA |
Set the calculation period for long-term MA. |
|
Signal |
Set the calculation period for MACD signal. |
9 |
|---|
MACD display |
|
Select ON to display MACD, or OFF to hide it. "Close" is used for "Applied price field". |
Short-term MA |
Set the calculation period for short-term MA. |
Long-term MA |
|
Set the calculation period for long-term MA. |
Signal |
|
Set the calculation period for MACD signal. |
ADX
Number |
Item name |
Description |
|---|---|---|
10 |
ADX display |
Select ON to display ADX, or OFF to hide it. |
|
Period |
Set the calculation period for ADX. |
10 |
|---|
ADX display |
|
Select ON to display ADX, or OFF to hide it. |
Period |
Set the calculation period for ADX. |
CCI
Number |
Item name |
Description |
|---|---|---|
11 |
CCI display |
Select ON to display CCI, or OFF to hide it. "Typical Price (HLC/3)" is used for "Applied price field". |
|
Period |
Set the calculation period for CCI. |
|
CCI threshold 1 |
When the CCI value reaches or exceeds the threshold 1, the value will be displayed in red as a high price level. |
|
CCI threshold 2 |
When the CCI value reaches or falls below the threshold 2, the value will be displayed in red as a low price level. |
11 |
|---|
CCI display |
|
Select ON to display CCI, or OFF to hide it. "Typical Price (HLC/3)" is used for "Applied price field". |
Period |
Set the calculation period for CCI. |
CCI threshold 1 |
|
When the CCI value reaches or exceeds the threshold 1, the value will be displayed in red as a high price level. |
CCI threshold 2 |
|
When the CCI value reaches or falls below the threshold 2, the value will be displayed in red as a low price level. |
RSI
Number |
Item name |
Description |
|---|---|---|
12 |
RSI display |
Select ON to display RSI, or OFF to hide it. "Close" is used for "Applied price field". |
|
Period |
Set the calculation period for RSI. |
|
RSI threshold 1 |
When the RSI value reaches or exceeds the threshold 1, the value will be displayed in red as a high price level. |
|
RSI threshold 2 |
When the RSI value reaches or falls below the threshold 2, the value will be displayed in red as a low price level. |
12 |
|---|
RSI display |
|
Select ON to display RSI, or OFF to hide it. "Close" is used for "Applied price field". |
Period |
Set the calculation period for RSI. |
RSI threshold 1 |
|
When the RSI value reaches or exceeds the threshold 1, the value will be displayed in red as a high price level. |
RSI threshold 2 |
|
When the RSI value reaches or falls below the threshold 2, the value will be displayed in red as a low price level. |
Parabolic SAR
Number |
Item name |
Description |
|---|---|---|
13 |
Parabolic SAR display |
Select ON to display parabolic SAR, or OFF to hide it. "Low/High" is used for "Applied price field". |
|
Step |
Set the size of the acceleration factor for the parabolic SAR. |
|
Maximum |
Set the maximum acceleration factor for the parabolic SAR. |
13 |
|---|
Parabolic SAR display |
|
Select ON to display parabolic SAR, or OFF to hide it. "Low/High" is used for "Applied price field". |
Step |
Set the size of the acceleration factor for the parabolic SAR. |
Maximum |
|
Set the maximum acceleration factor for the parabolic SAR. |
If you set a small value for the "Refresh rate (seconds)", MetaTrader4/MetaTrader5 may run slower than usual. The performance depends on your PC specifications, so please check your optimal settings beforehand for the best experience.
![]()
Created
: 2022.06.29
![]()
Last updated
: 2026.03.11
Disclaimer:![]()
All information and content provided on this website is provided for informational purposes only and is not intended to solicit any investment. Although all efforts are made in order to ensure that the information is correct, no guarantee is provided for the accuracy of any content on this website. Any decision made shall be the responsibility of the investor and Myforex does not take any responsibility whatsoever regarding the use of any information provided herein.
The copyright in our content belongs to us.
We welcome your use of our content within appropriate limits, including use through our sharing features, sharing on social media, and quotation. However, please refrain from unauthorized reuse, including but not limited to commercial use, reproduction with modification of content, or reproduction on websites that compete with us. We may take necessary measures, including but not limited to deletion of the relevant content, if we consider that the content has been used in an inappropriate or unauthorized manner.
Myforex uses cookies to improve the convenience and functionality of this website. This website may include cookies not only by us but also by third parties (advertisers, log analysts, etc.) for the purpose of tracking the activities of users. Cookie policy
