
- English
- English
- What's Myforex
- Share
- Use tools
- Get information
- What's New
- Help center
- About us
- Customer support
- Terms and policies


-

-
 Real-time spread comparisonCompare spreads of major retail brokers in real time
 -
 Volatility analysisVisualize volatility as a measure of daily market activity
 -
 Swap point comparisonCompare buy and sell swap values for each broker by symbol
 -
 Market rates & chartsCheck prices for all instruments offered by each broker
 -
 IndicatorsProviding in-house developed indicators for MT4/MT5
 -
 Trading calculatorsCalculation tools for each broker to help you trade


Chart overlay indicator

- Overview
- How to install
- How to set up
Display:


![]()
![]()
![]()
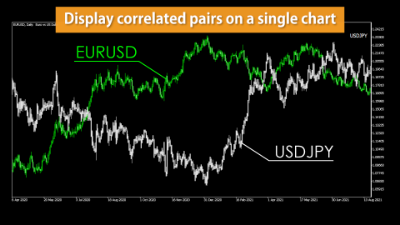
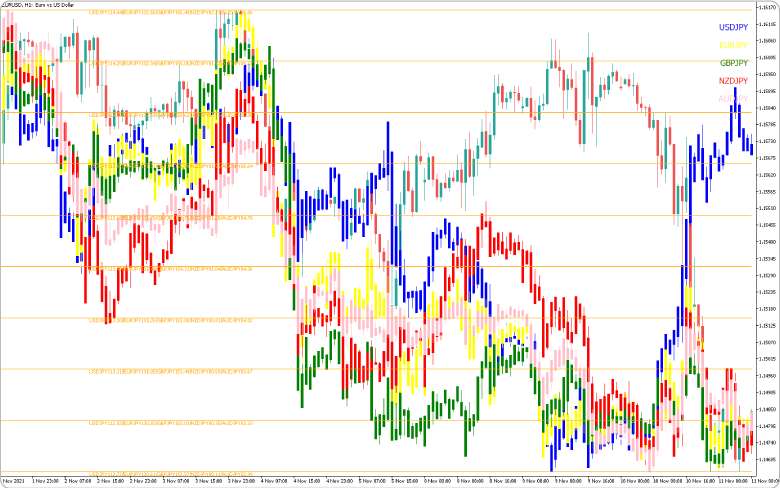
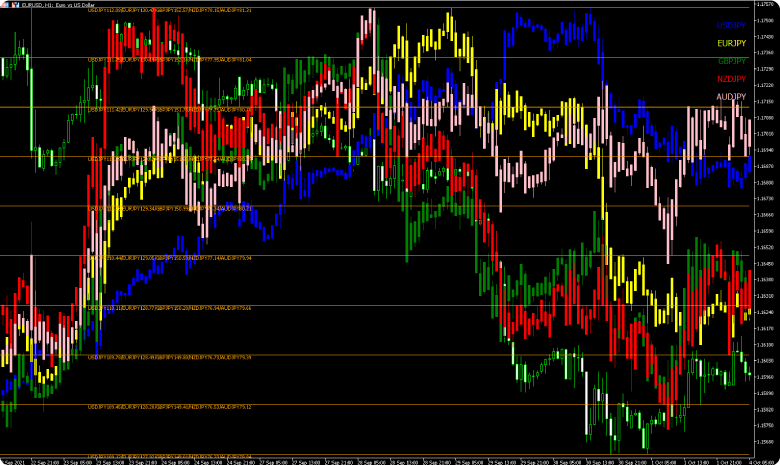
The chart overlay indicator is an indicator that displays up to five additional symbols on a single chart. It displays correlated symbols such as EUR/USD and GBP/USD at once. Also, it can display stock indices e.g. Dow Jones Index on the Forex charts at the same time to help you trade well.
![]()
![]()
![]()
Features
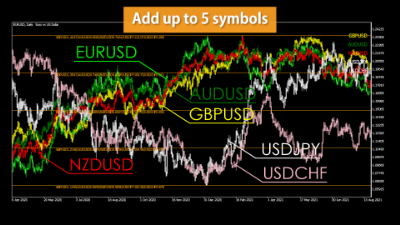
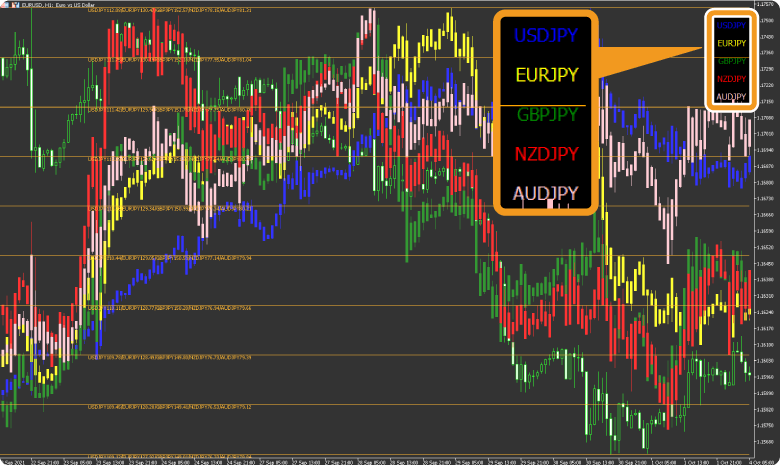
View up to 5 additional symbols
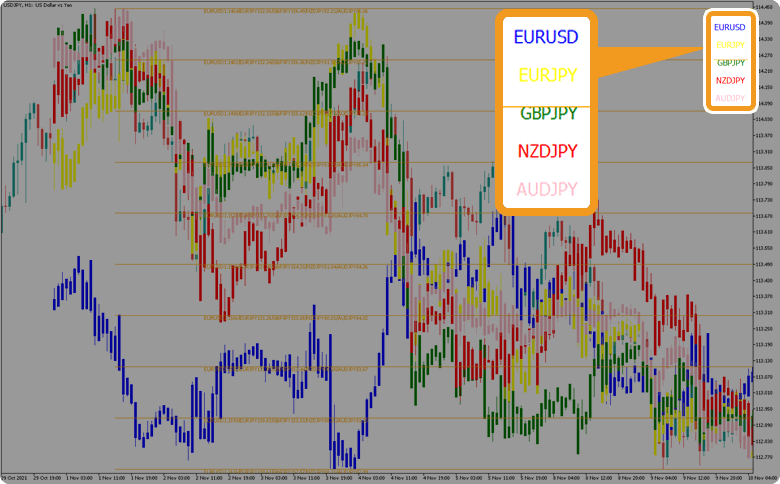
It can display the chart of up to 5 additional symbols when you are viewing the chart of a symbol. Each additional symbol can be viewed with respective colors that you set. The charts will show which color corresponds to which symbol, so you will have a clear indication.
This indicator is displayed as a candlestick chart, regardless of the chart format it is pasted into. MetaTrader5 allows you to choose among three different formats: bar chart/candlesticks/line chart. However, even if you paste an indicator on a chart that is not a candlestick, only the original chart will be displayed as a bar chart or line chart, and the chart of the other symbols will be displayed on it as a candlestick chart.
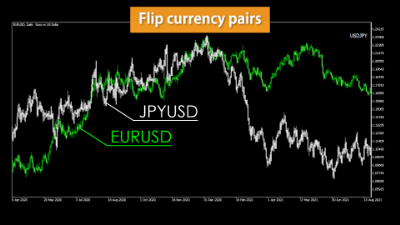
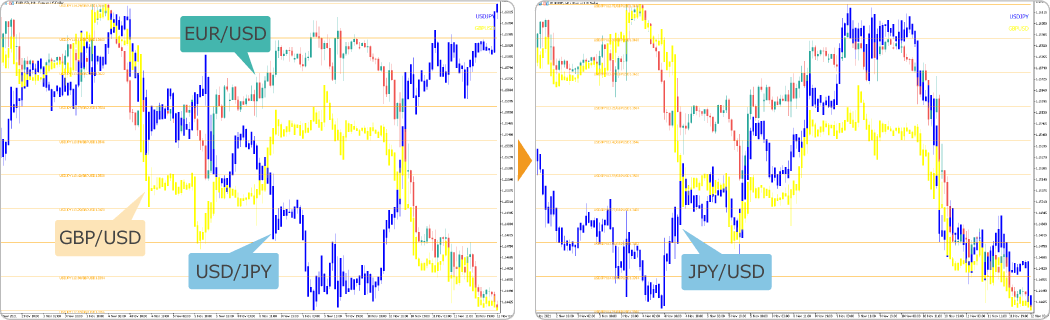
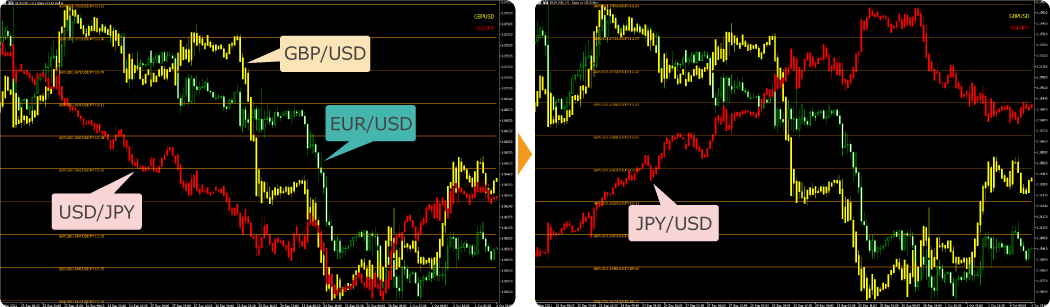
Currency pairs can be inversed
"When displaying the chart of a currency pair as it is, if you set the parameter “Symbol inversion” to ON, it will display the currency pair inverted.e.g., USD/JPY like 1USD=100JPY to JPY/USD like 1JPY=0.01USD"
When strong/weak USD is trending in the “USD/JPY" format, the price movements are the exact opposite of those of the other USD pairs such as EUR/USD, GBP/USD, etc. By inversing to ''JPY/USD" display, the chart will show a downward trend in strong USD, or an upward trend in weak USD, just like other symbols. This makes it easier to compare price volatility.
Adjustable rate line interval
Each symbol has a different rate. The rates are displayed at arbitrary intervals. You can adjust the number of lines from 0 to 10 by entering an integer between 0 and 10 in the parameter "Number of lines".
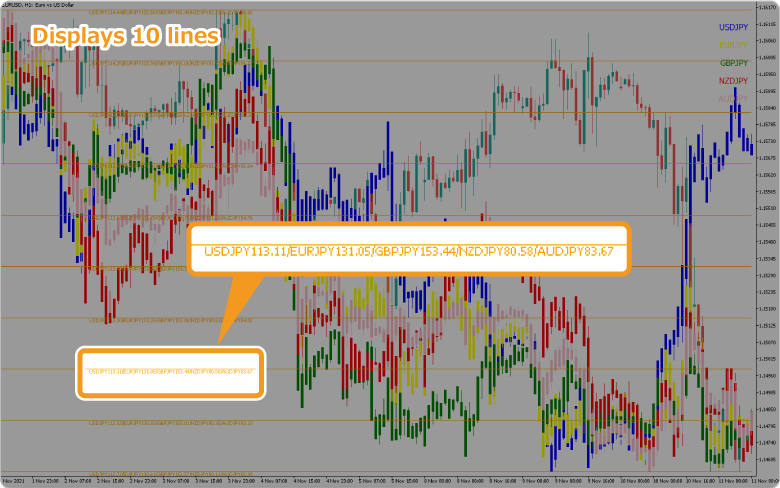
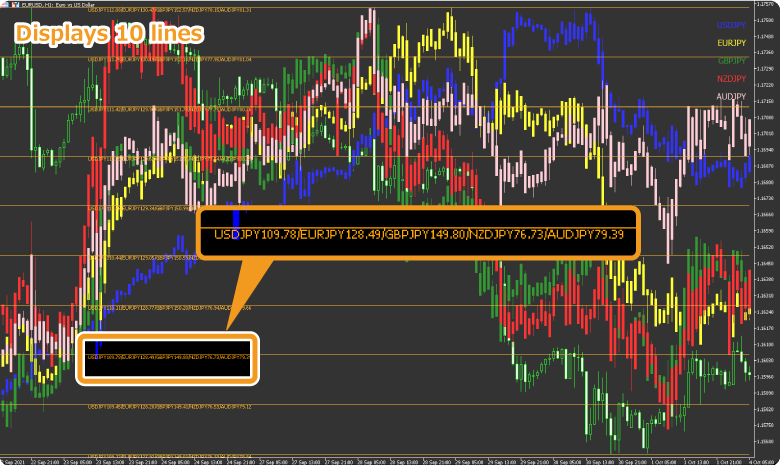
Please note that the price range (pips) between the lines is different for each symbol. The highest price is placed at the top of the line and the lowest price is placed at the bottom of the line during the period specified in the parameter "Number of candlesticks”. The price range between lines will be larger with higher price volatility.
How to install
To use the chart overlay indicator, install the "【Myforex】Chart Overlay Indicator" file on MetaTrader4/MetaTrader5.
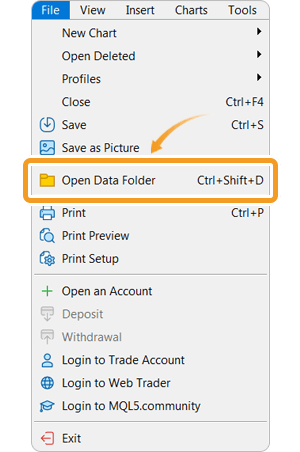
Step 1
Click "File" from the menu bar at the top of MetaTrader4/MetaTrader5 and choose "Open Data Folder".
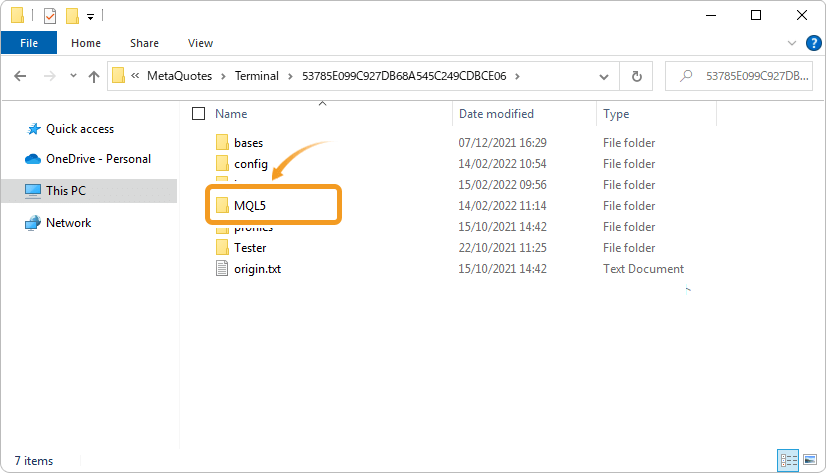
Step 2
After opening the data folder, double-click the folder "MQL5 (MQL4 for MetaTrader4)" in it to open it.
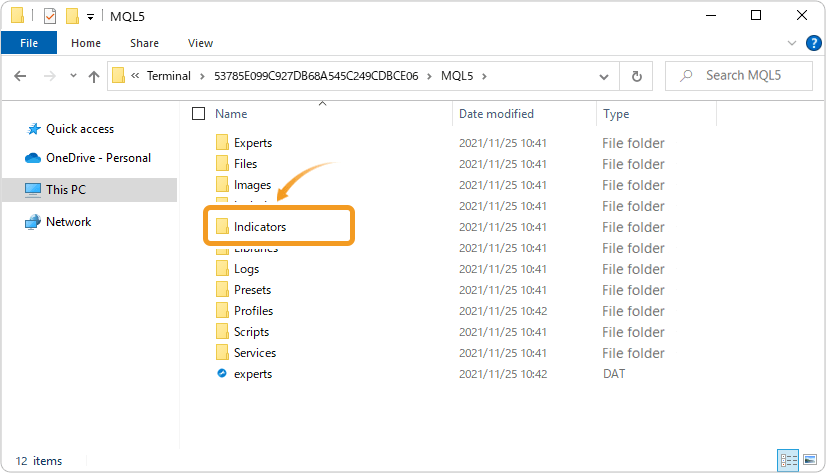
Step 3
Double-click to open "Indicators" folder in the MQL5 file.
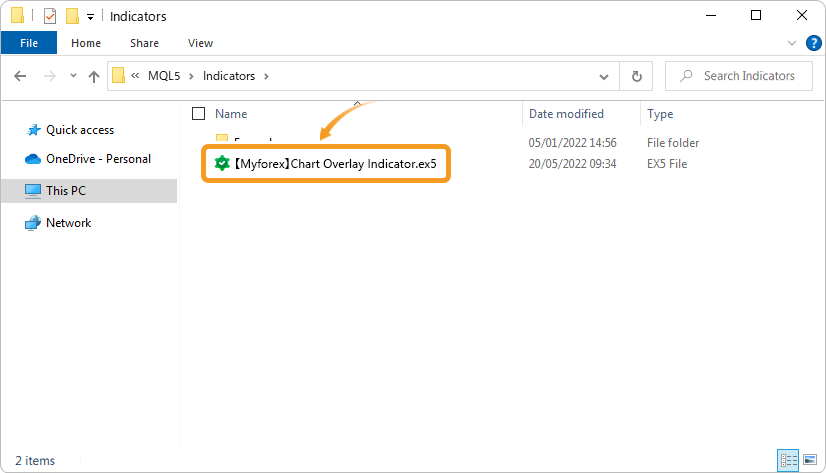
Step 4
Save the "【Myforex】Chart Overlay Indicator" in the "Indicators" folder.
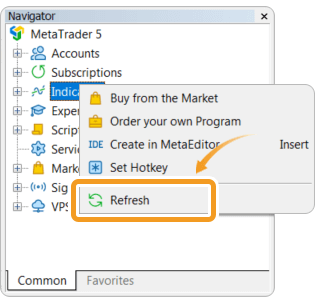
Step 5
Once the file is in the folder, right-click "Indicators" in the Navigator and choose "Refresh" from the displayed menu.
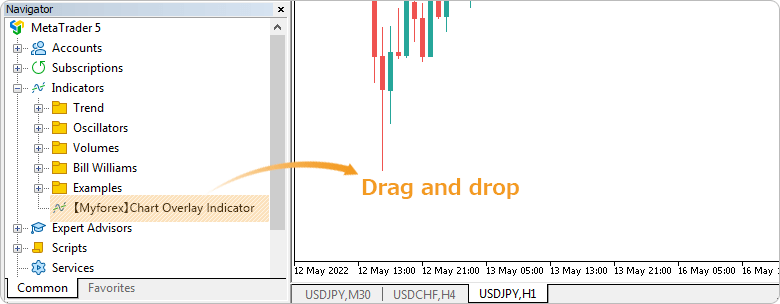
Step 6
After checking that the chart overlay indicator is shown in the "Indicators" of the Navigator, apply it to a chart by double-clicking or dragging and dropping.
Step 7
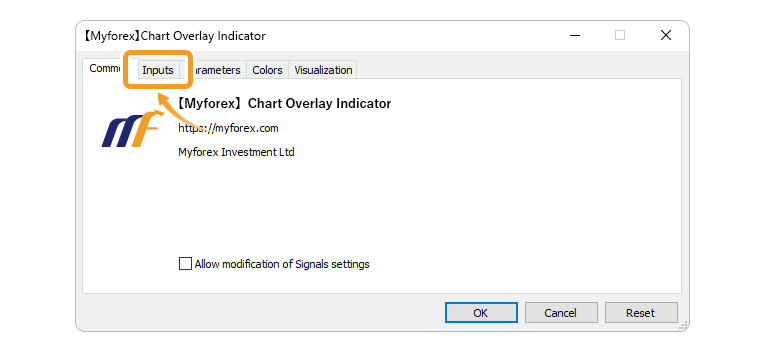
The chart overlay indicator setting window will appear. Refer to the "How to set up" page to make further settings in the "Inputs" tab, then click "OK".
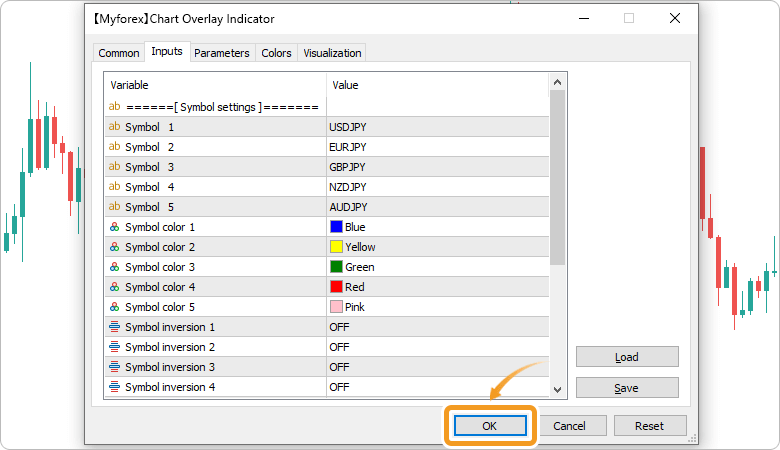
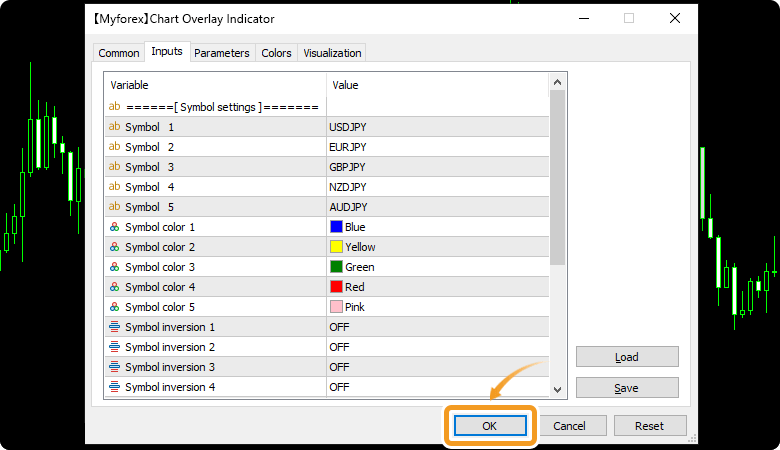
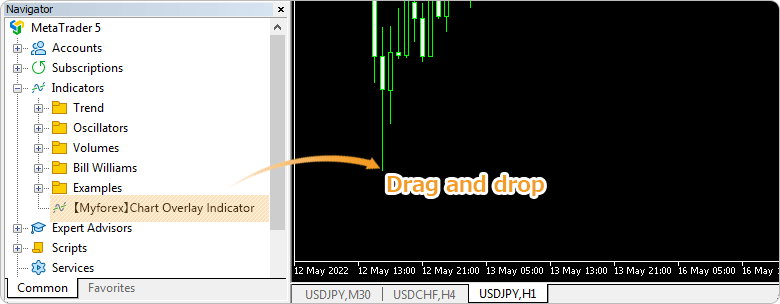
Step 8
The chart overlay indicator is applied to the chart and the chart of another symbol will be displayed.
How to set up
After applying the indicator to the chart, set the parameters according to your style.
Step 1
First, open the "Inputs" tab.
Step 2
Set the parameters as follows.
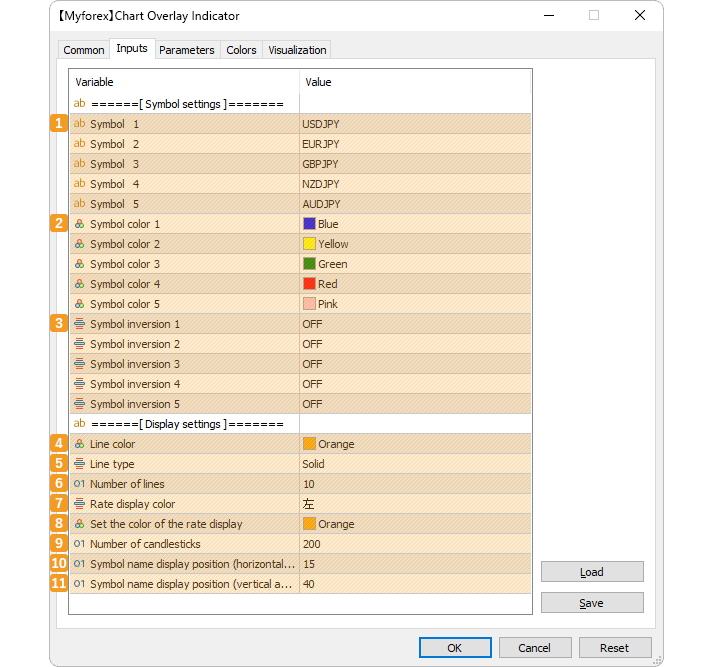
Symbol settings
Number |
Item name |
Description |
|---|---|---|
1 |
Symbol 1-5 |
Specify the symbol name including suffix (characters after the symbol name). |
2 |
Symbol color 1-5 |
Set the color for charts to display. |
3 |
Symbol inversion 1-5 |
Enable/disable inversion for the currency pairs. If it's ON, USD/JPY will be converted into JPY/USD. |
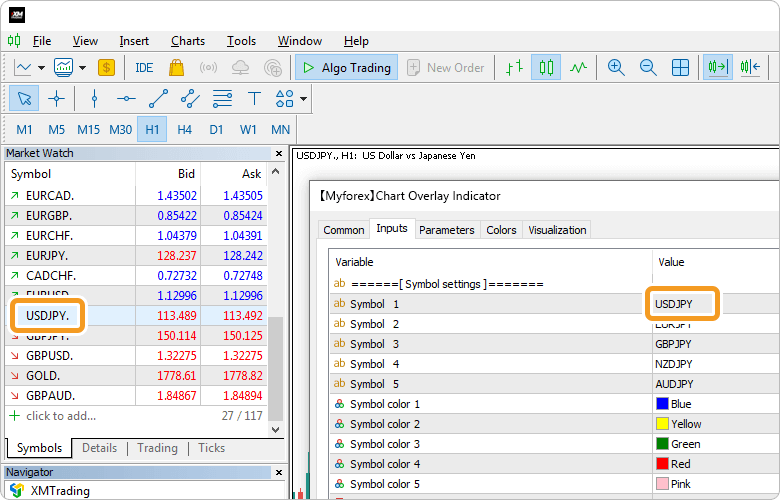
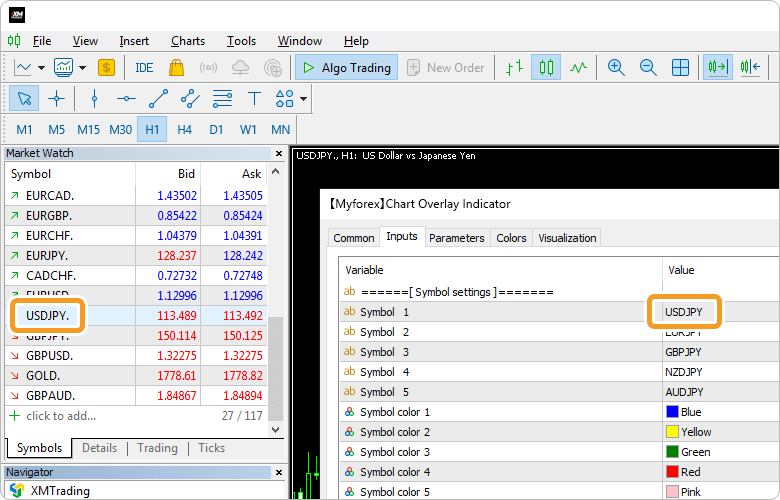
For each Forex company and account type, there may be a symbol or alphabetic character after the symbol code, e.g."USDJPY.’’. Please fill in the parameter with the correct symbol name of your Forex account. Otherwise, it will not work. Please check the Market Watch etc. and fill it in correctly.
Display settings
Number |
Item name |
Description |
|---|---|---|
4 |
Line color |
Set the color of the rate line. |
5 |
Line type |
Set the line type of the rate line. |
6 |
Number of lines |
Specify the number of rate lines. |
7 |
Rate display position |
Set the position of the rate display. Please choose either "Left" or "Right". |
8 |
Rate display color |
Set the color of the rate display. |
9 |
Number of candlesticks |
Specify the number of candlesticks of the overlaying charts. Example: if you enter "200", the chart will be displayed up to the 200th candlestick back from the current one. |
10 |
Symbol name display position |
Specify the position of symbol names on the horizontal axis. They correspond to the color of each chart. 0 is at the rightmost position and increasing the number moves it to the left. |
11 |
Symbol name display position |
Specify the position of symbol names on the vertical axis. They correspond to the color of each chart. 0 is at the top position and increasing the number moves it to the lower. |
![]()
Created
: 2022.05.26
![]()
Last updated
: 2026.03.11
Disclaimer:![]()
All information and content provided on this website is provided for informational purposes only and is not intended to solicit any investment. Although all efforts are made in order to ensure that the information is correct, no guarantee is provided for the accuracy of any content on this website. Any decision made shall be the responsibility of the investor and Myforex does not take any responsibility whatsoever regarding the use of any information provided herein.
The copyright in our content belongs to us.
We welcome your use of our content within appropriate limits, including use through our sharing features, sharing on social media, and quotation. However, please refrain from unauthorized reuse, including but not limited to commercial use, reproduction with modification of content, or reproduction on websites that compete with us. We may take necessary measures, including but not limited to deletion of the relevant content, if we consider that the content has been used in an inappropriate or unauthorized manner.
Myforex uses cookies to improve the convenience and functionality of this website. This website may include cookies not only by us but also by third parties (advertisers, log analysts, etc.) for the purpose of tracking the activities of users. Cookie policy
