


Created
: 2022.10.03


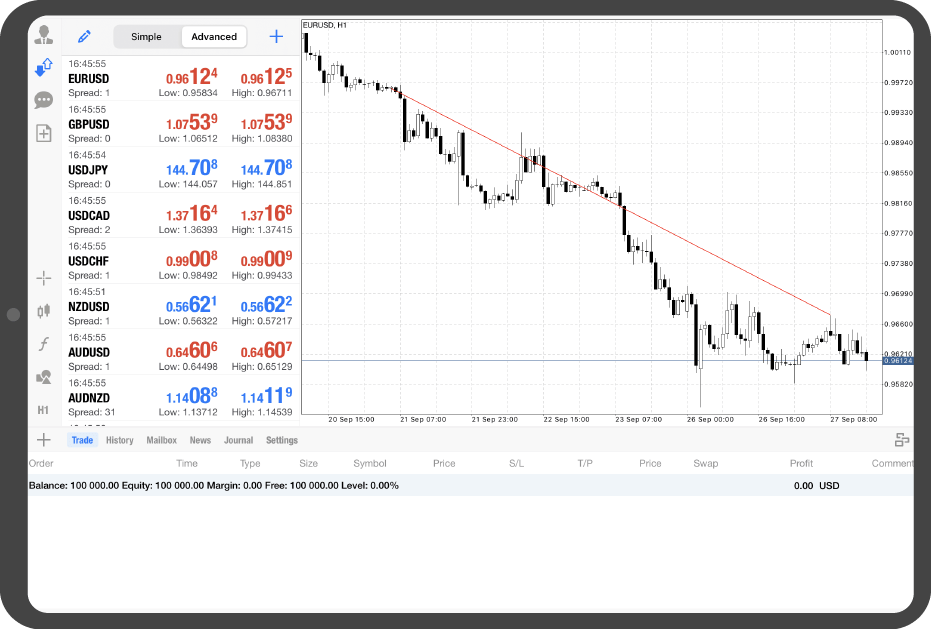
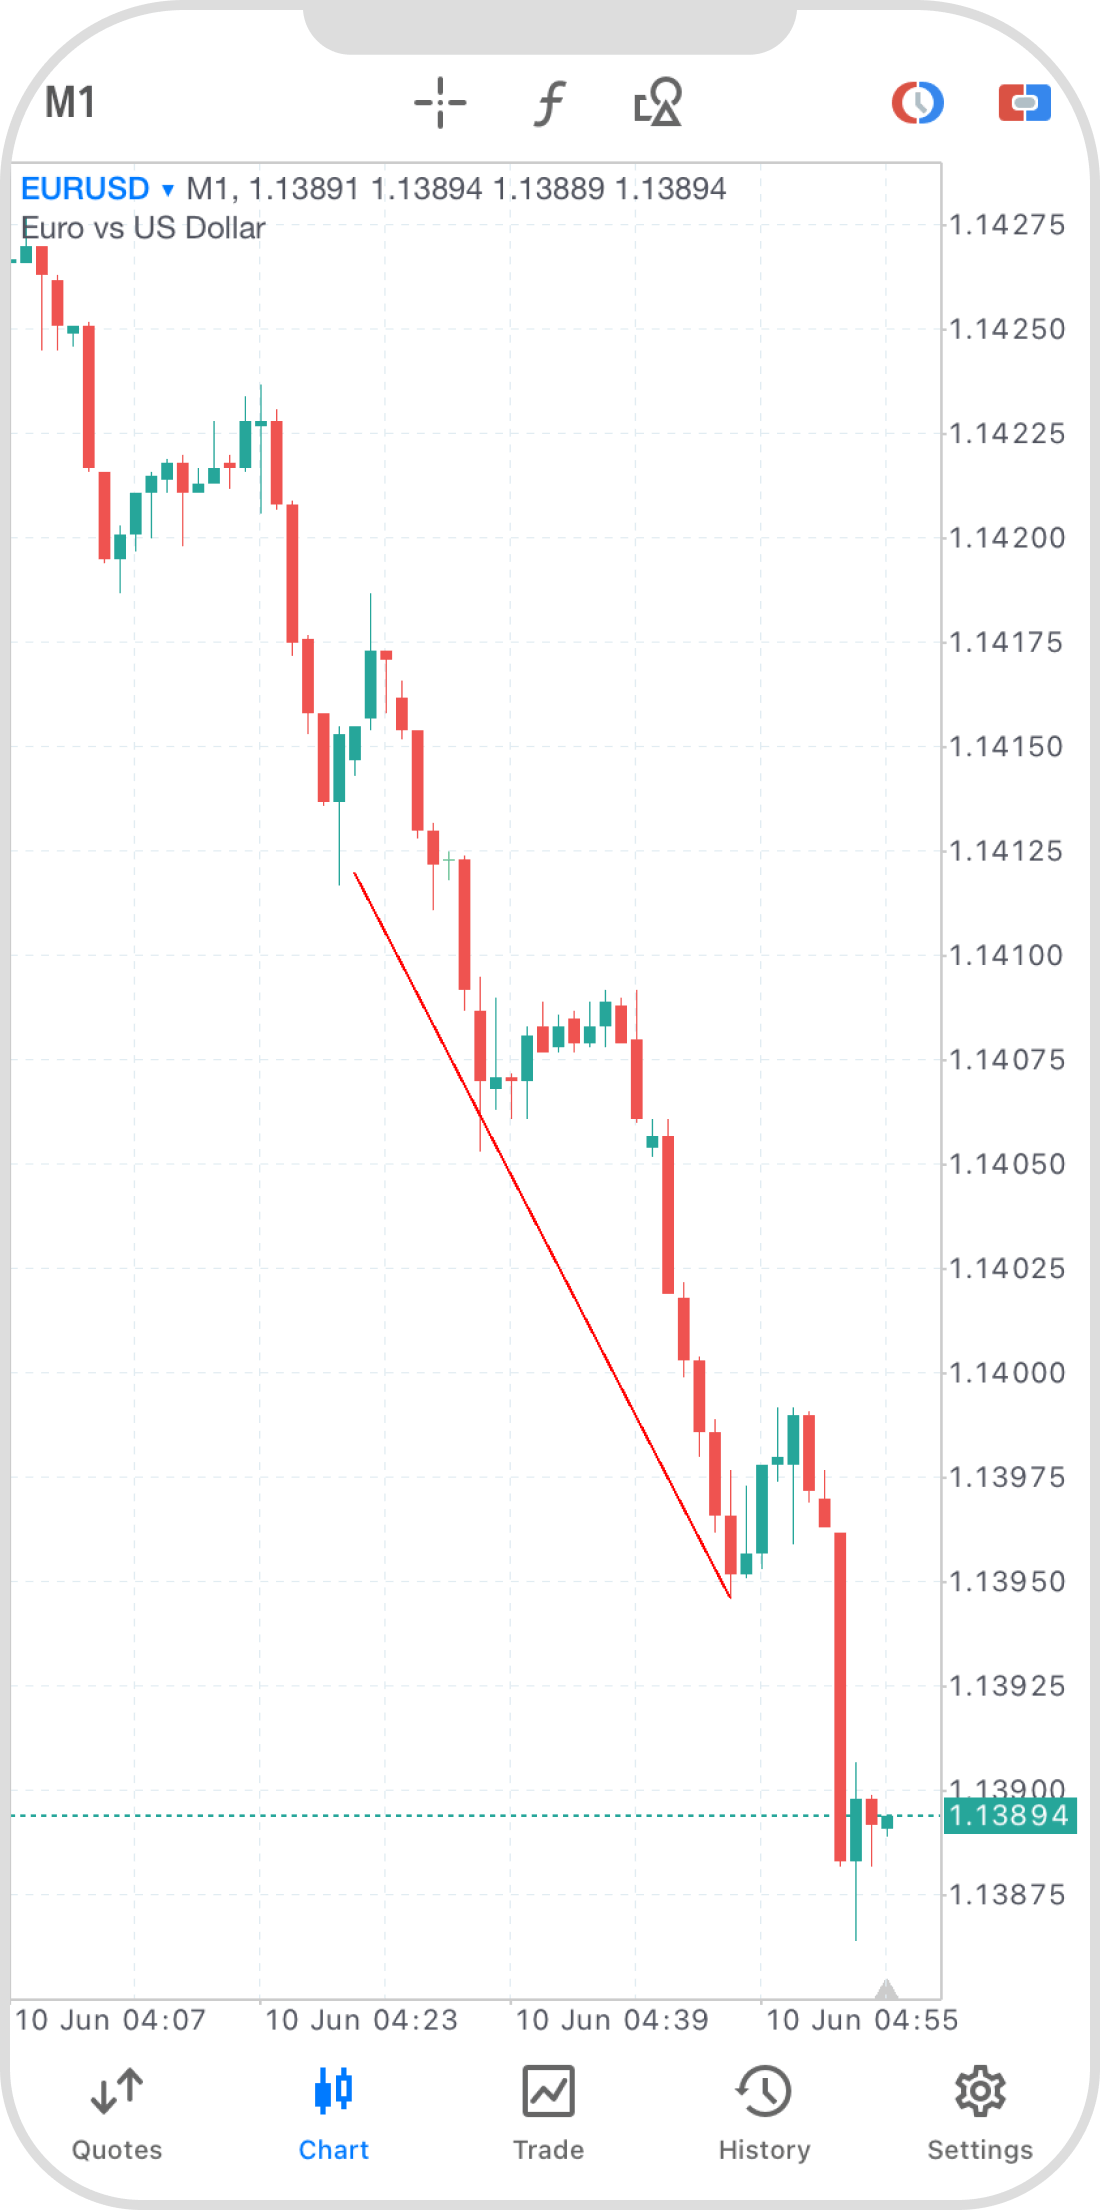
Here we'll look over the steps on how to display a trendline on the chart in MetaTrader4 (MT4) / MetaTrader5 (MT5) app for Android and iOS mobile devices. Trendline connects the low, high, or close prices to read trend strength or support and resistance lines. Combining trendlines allows for chart pattern analysis, which focuses on chart shapes.
| Related article: | Draw trendline by angle |
| Draw cycle lines |
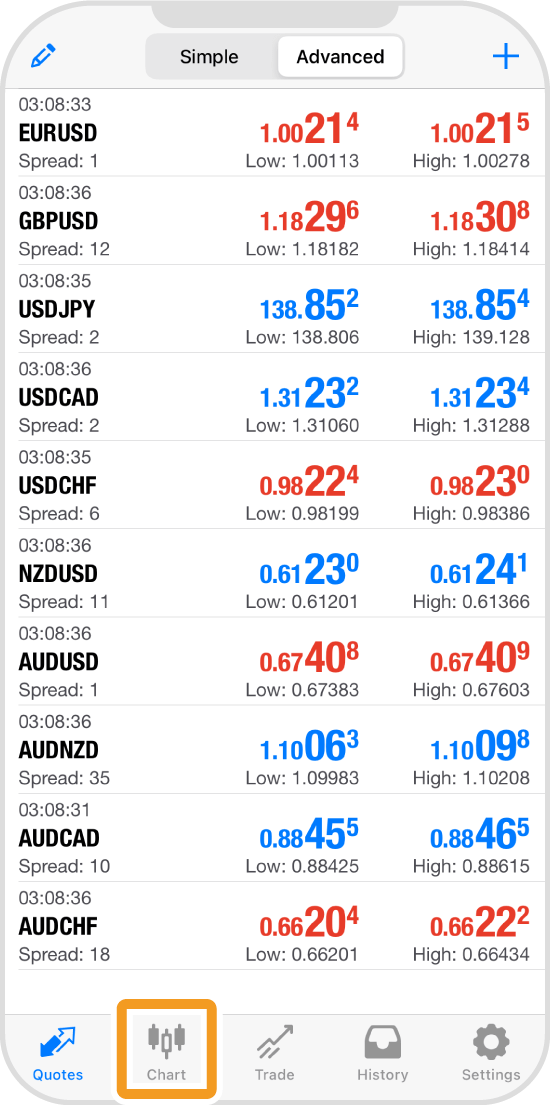
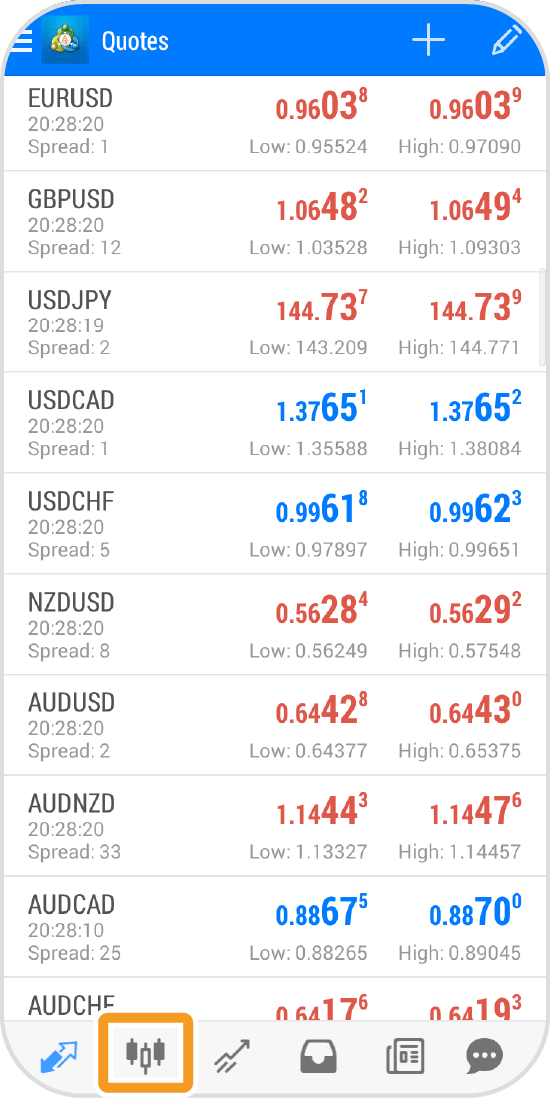
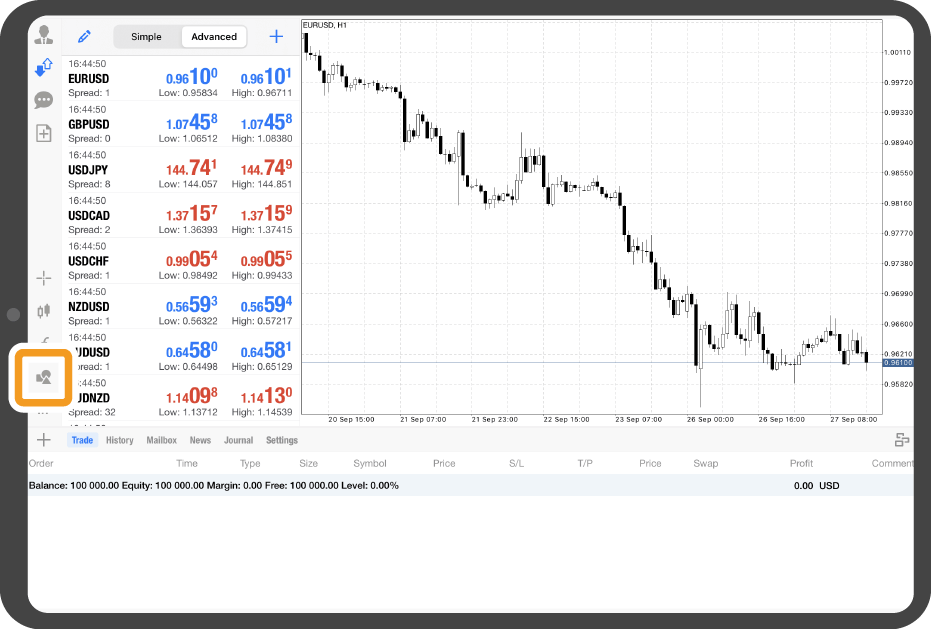
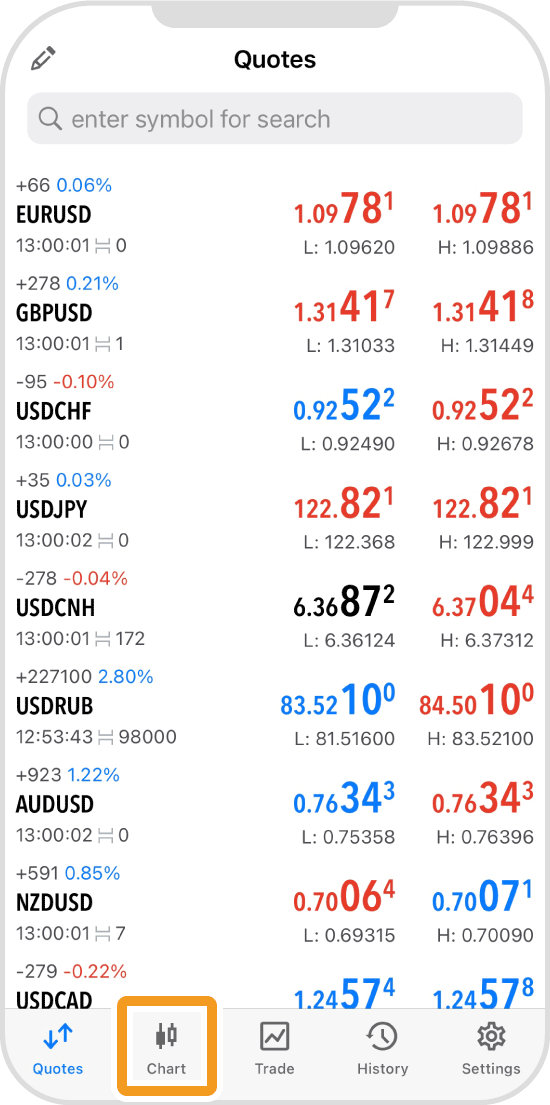
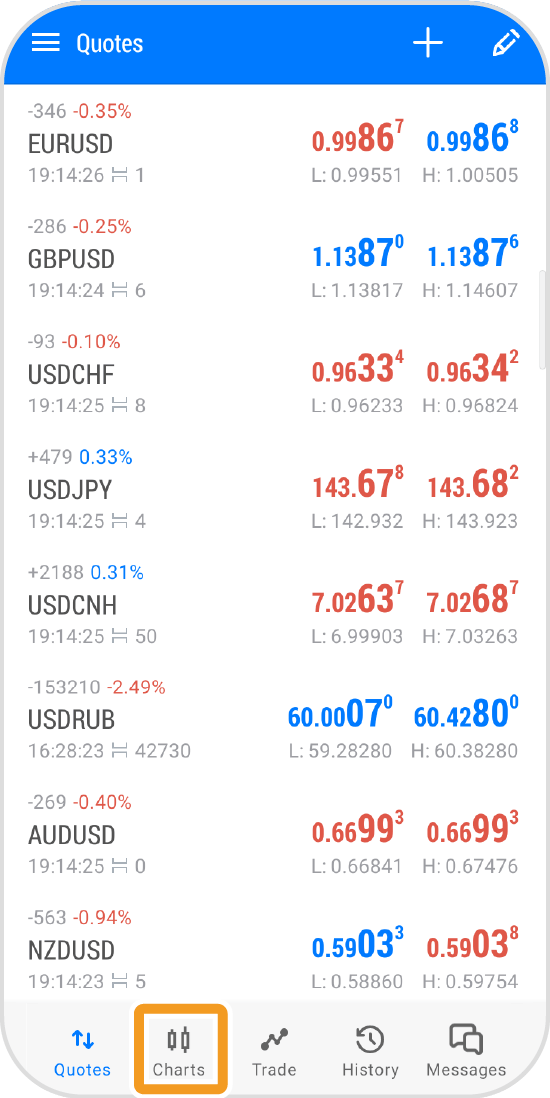
Tap "Chart" on the bottom navigation bar.
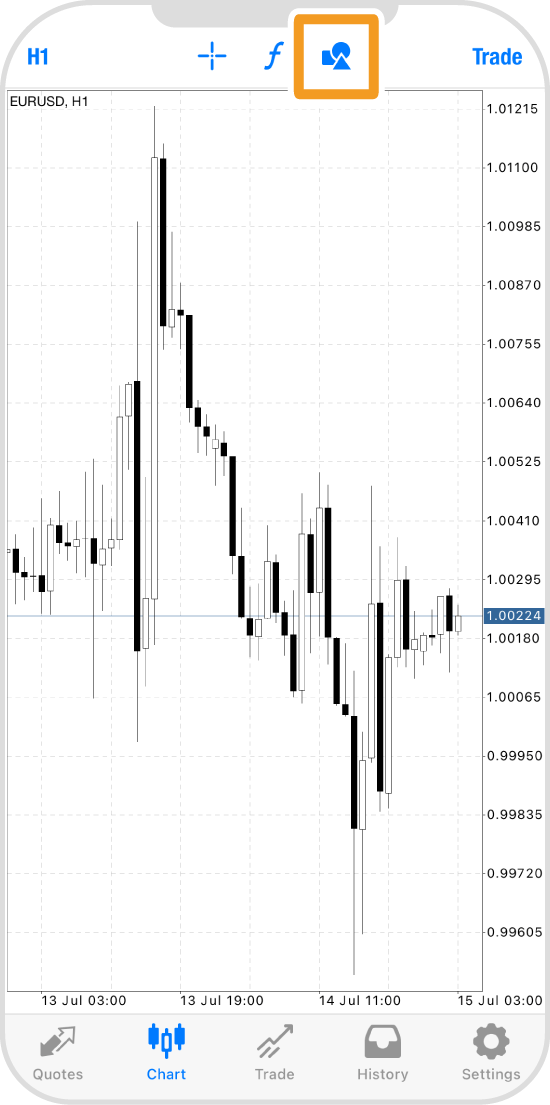
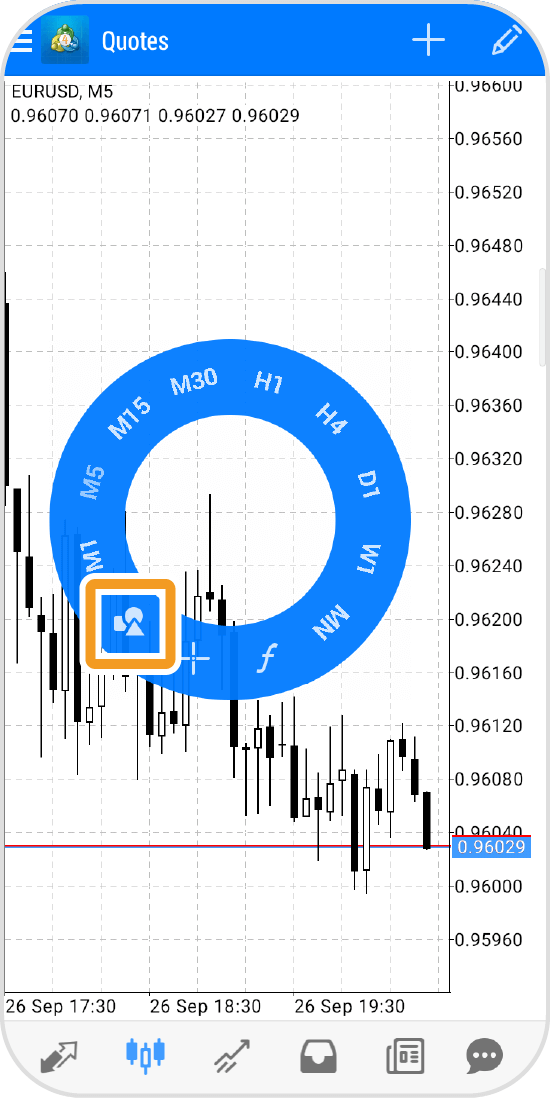
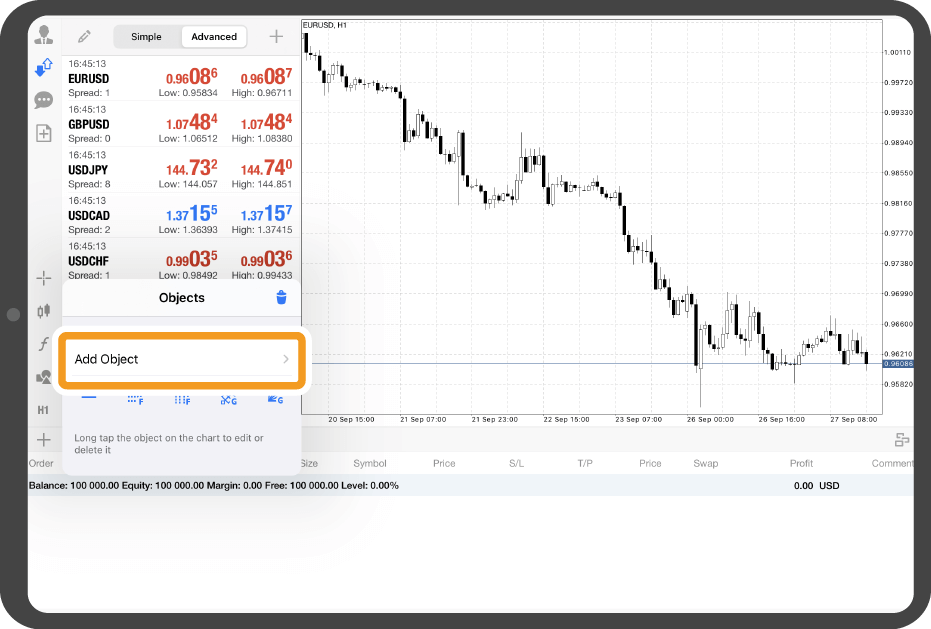
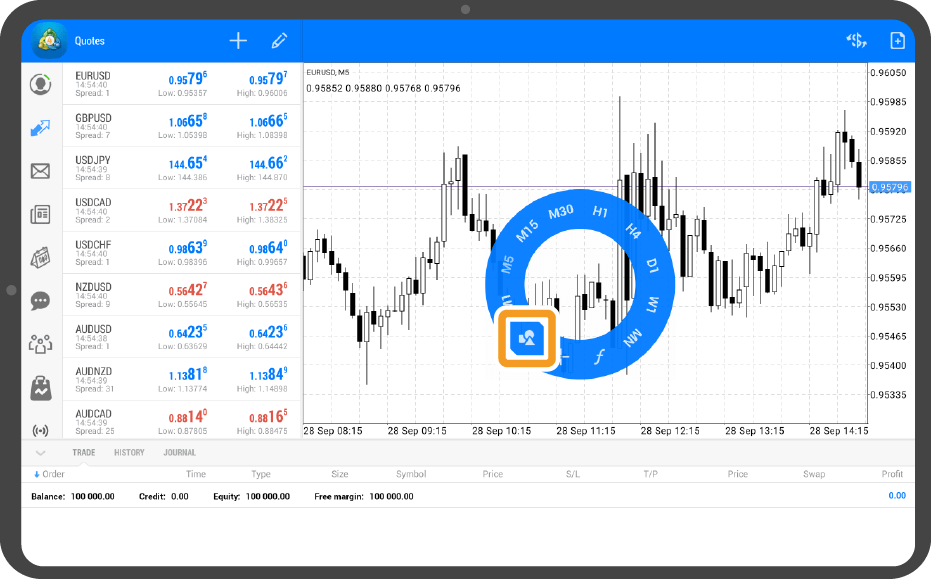
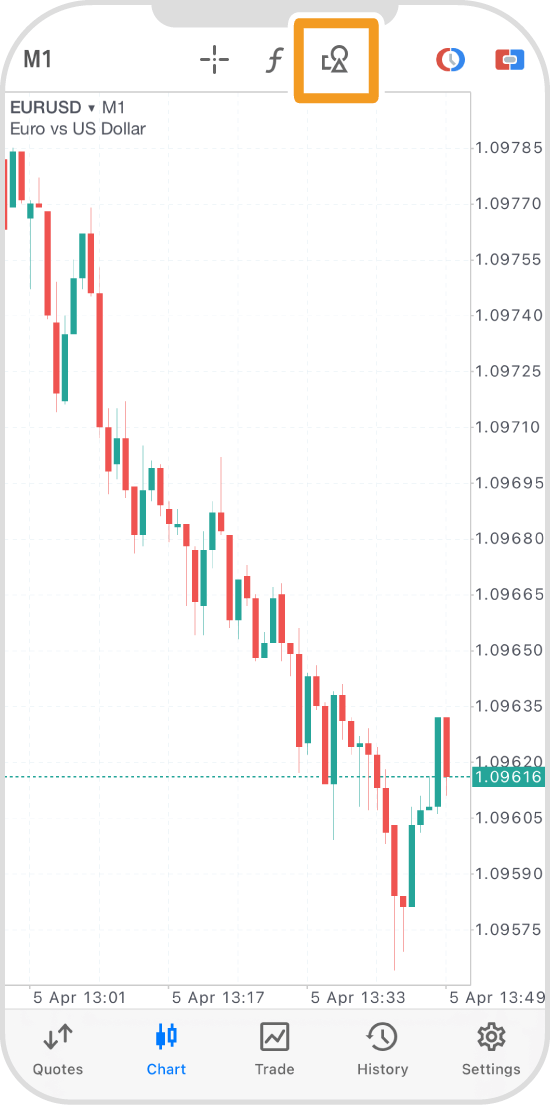
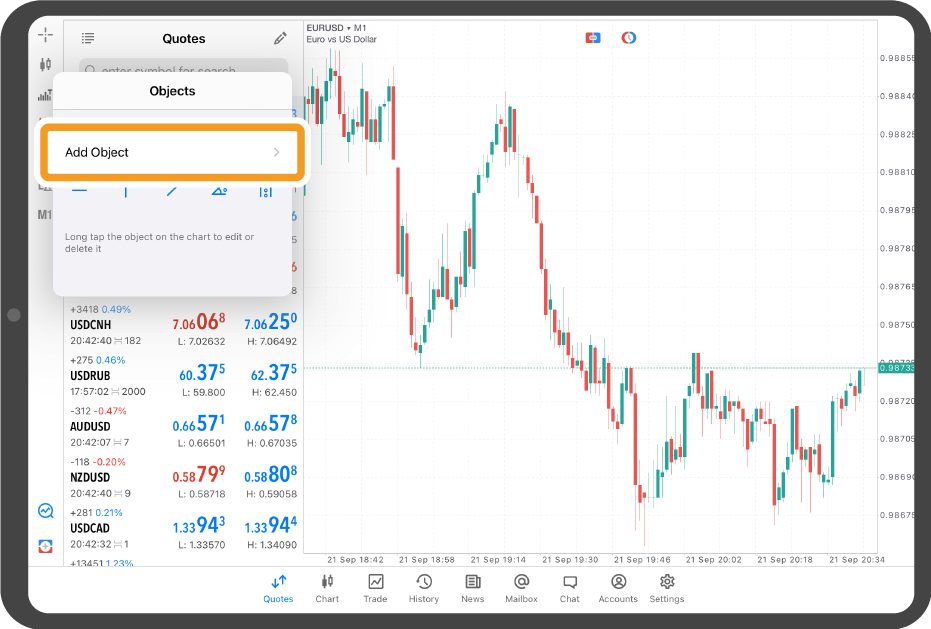
Tap the "Objects" icon at the top.
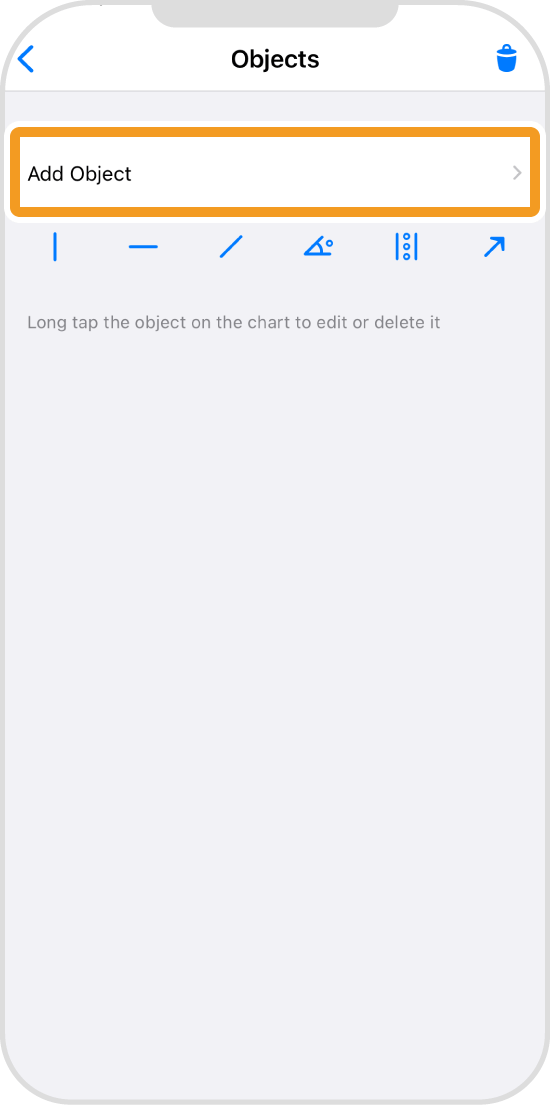
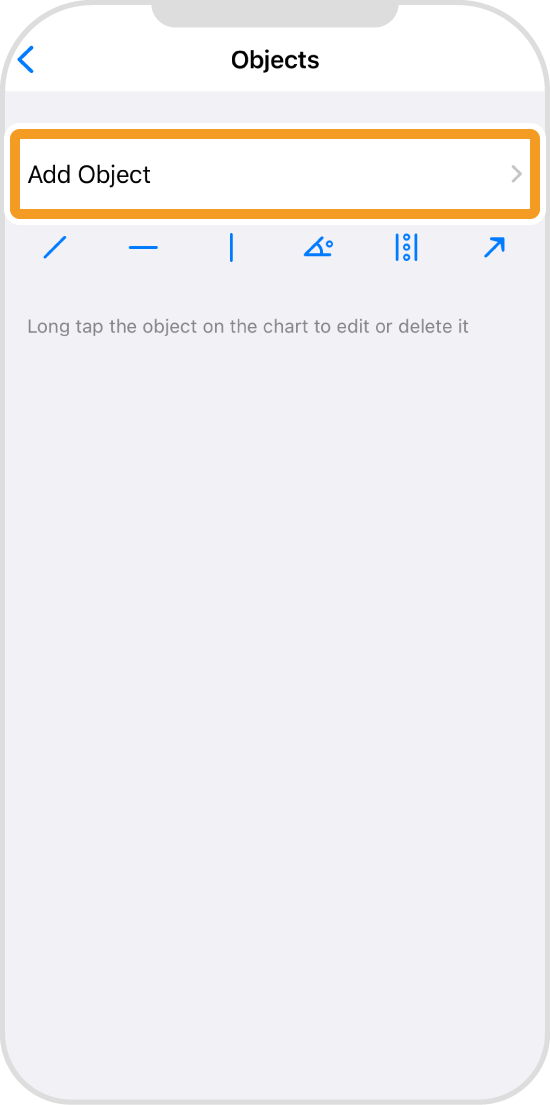
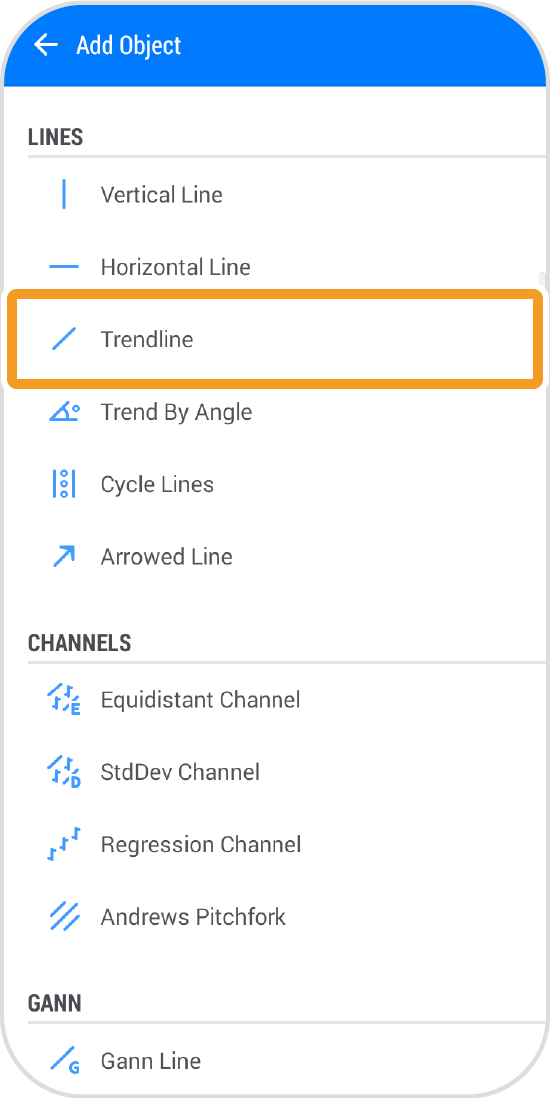
Tap "Add Object".
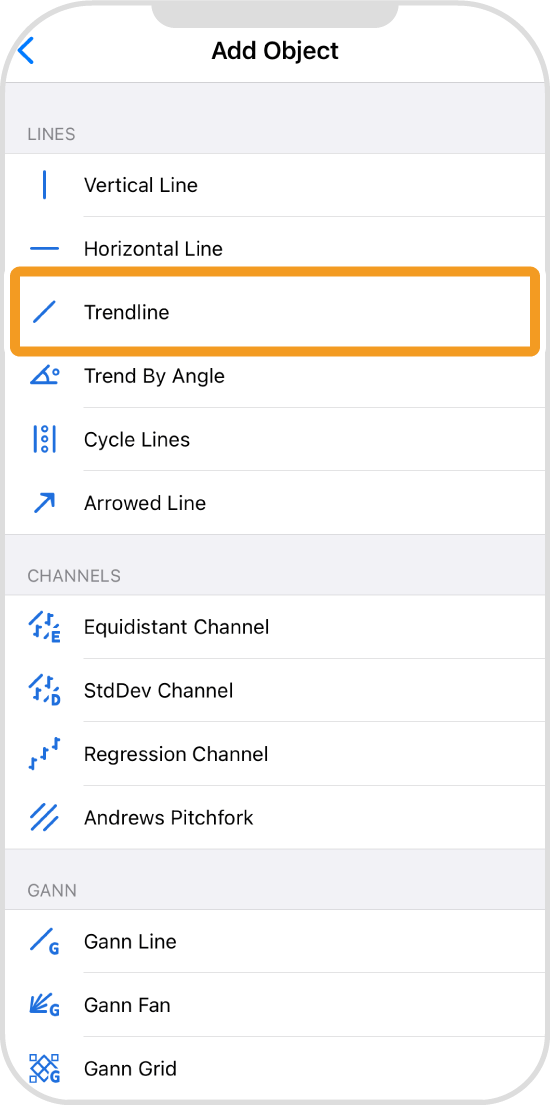
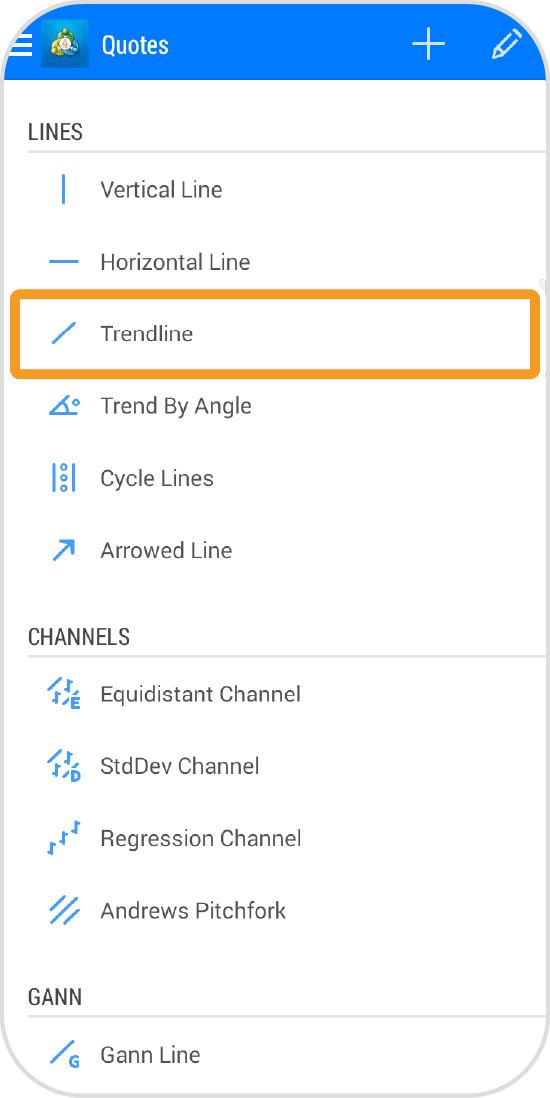
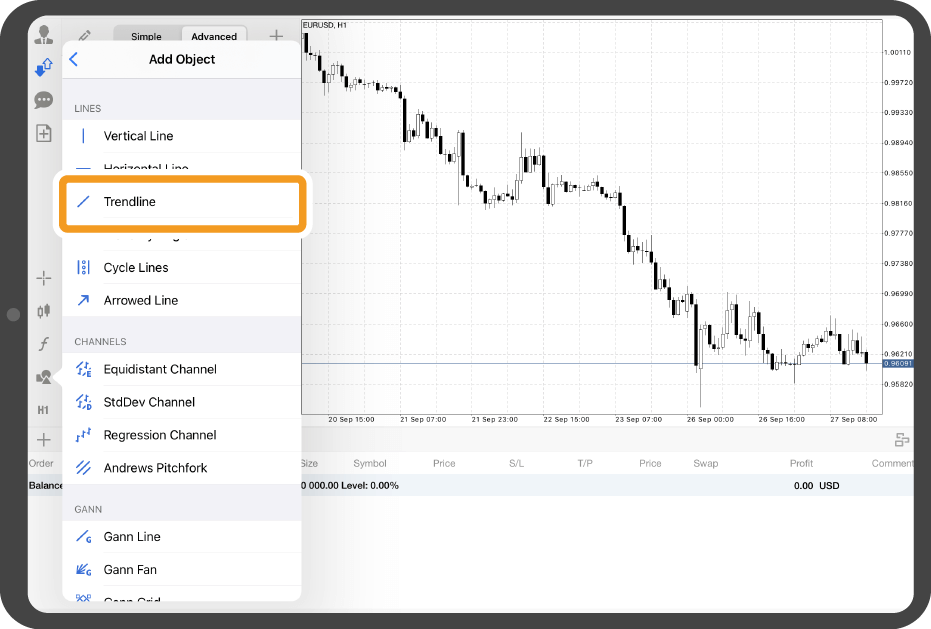
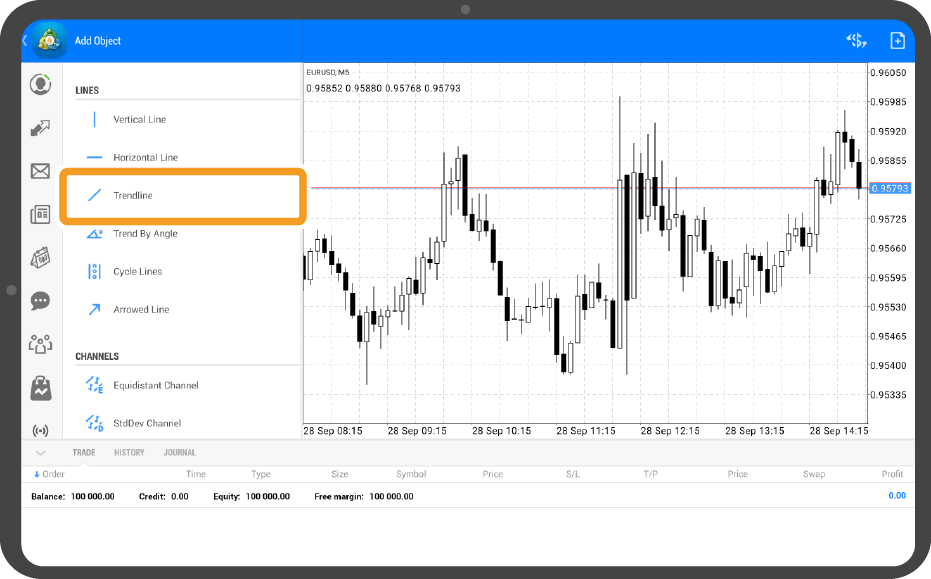
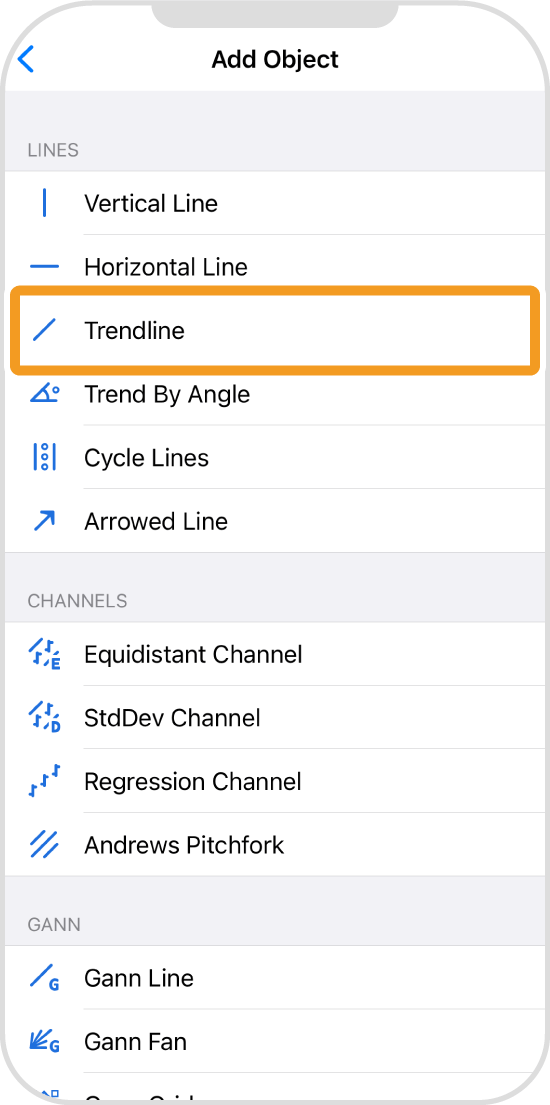
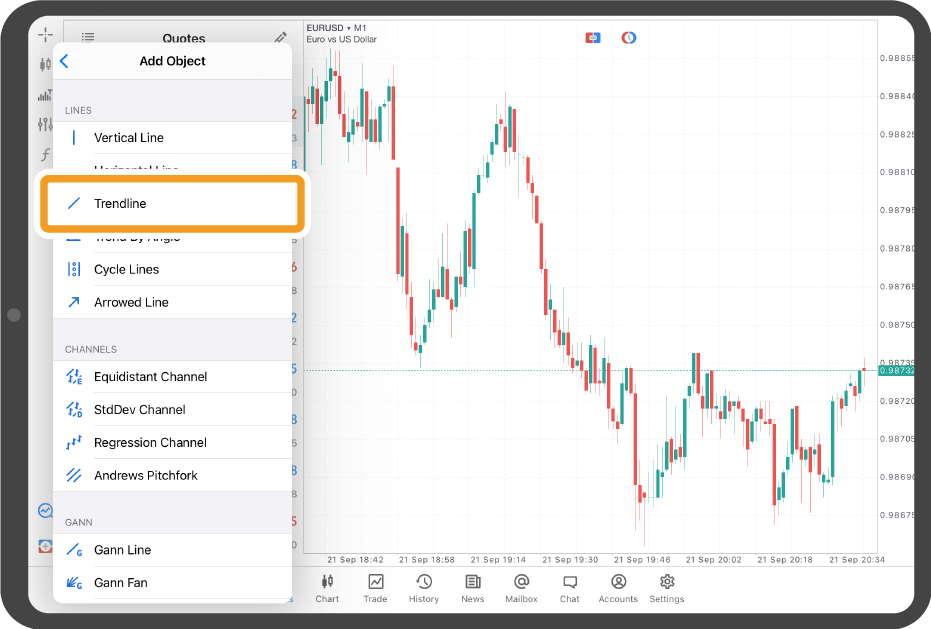
Tap "Trendline".
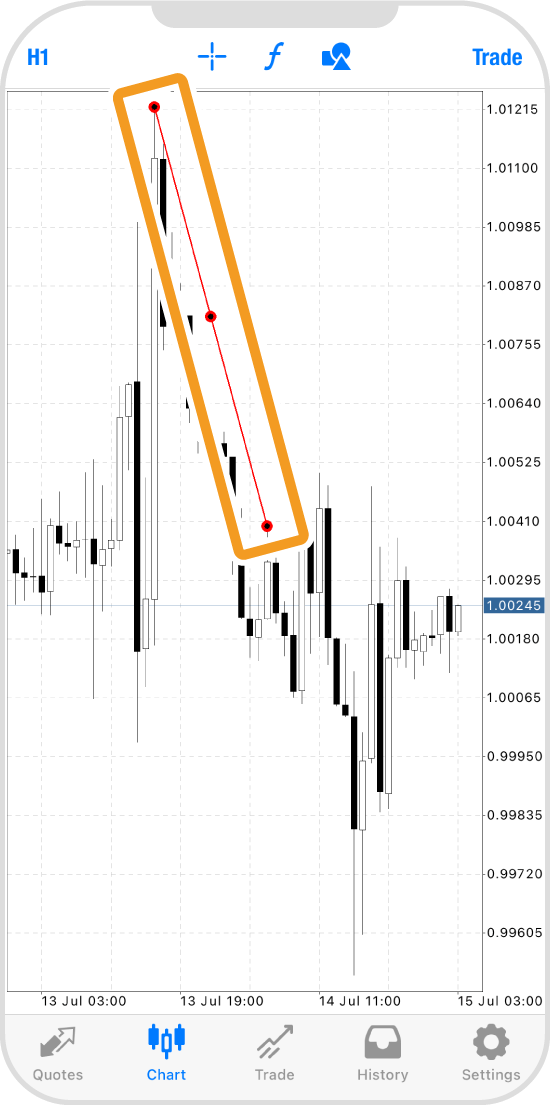
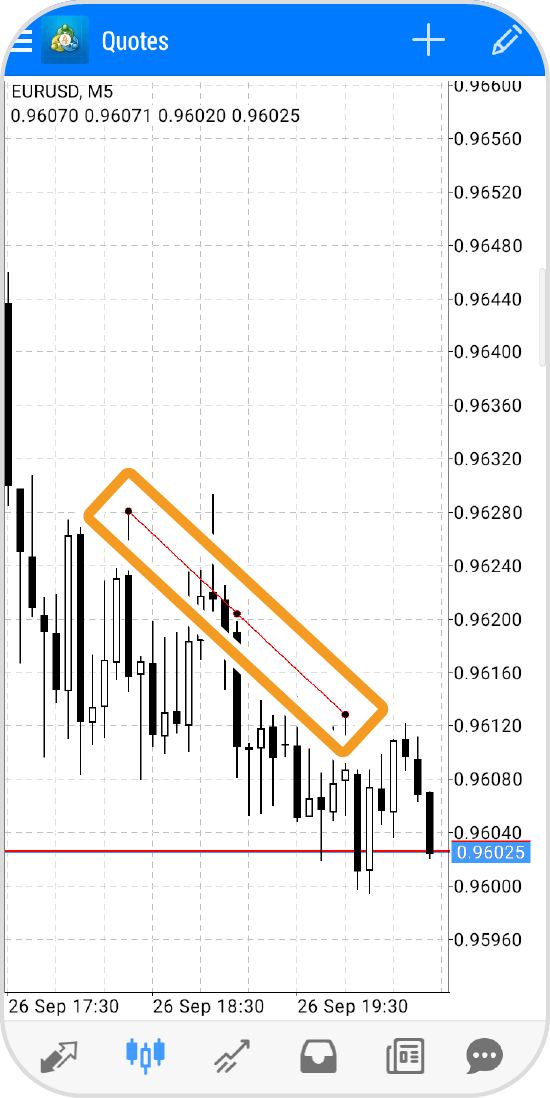
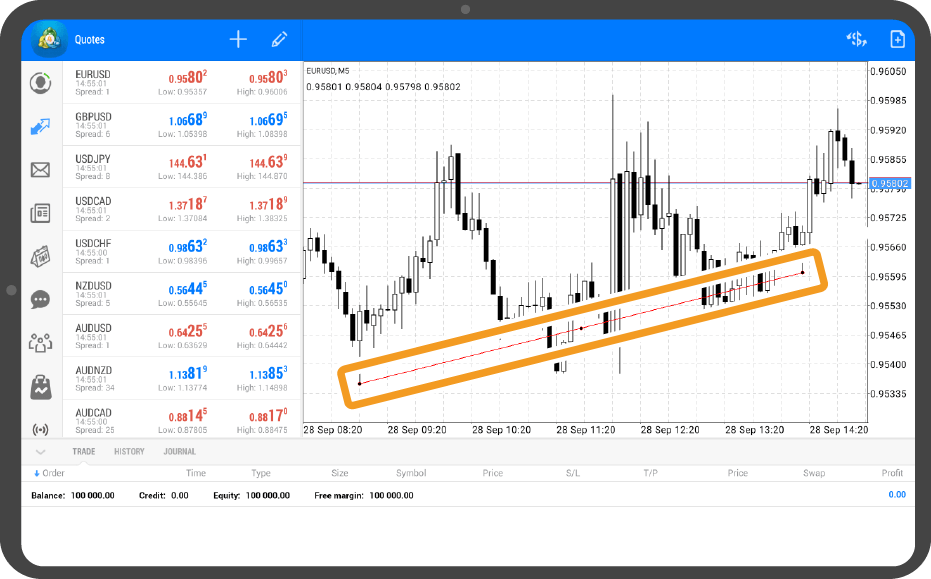
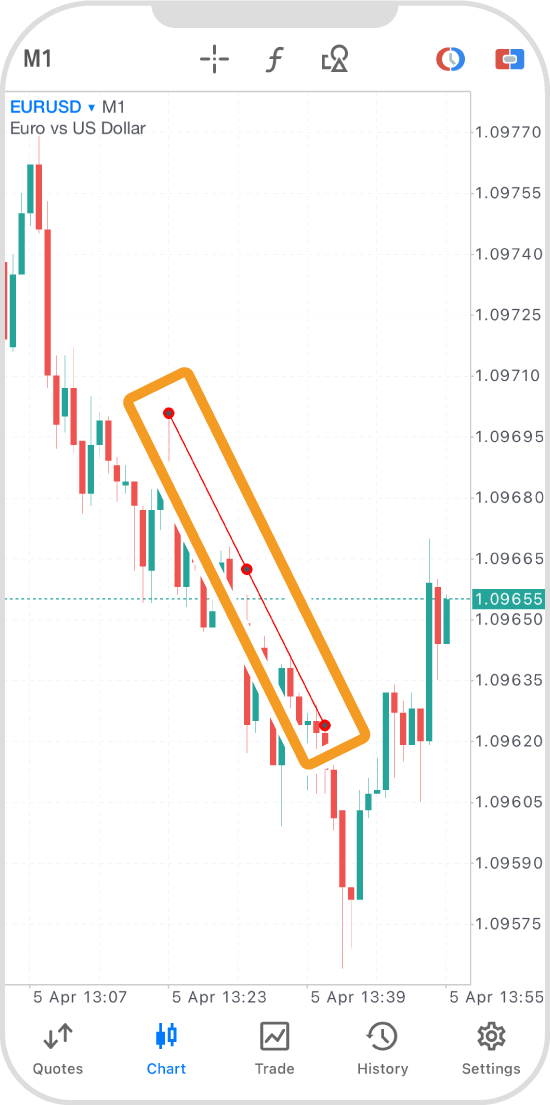
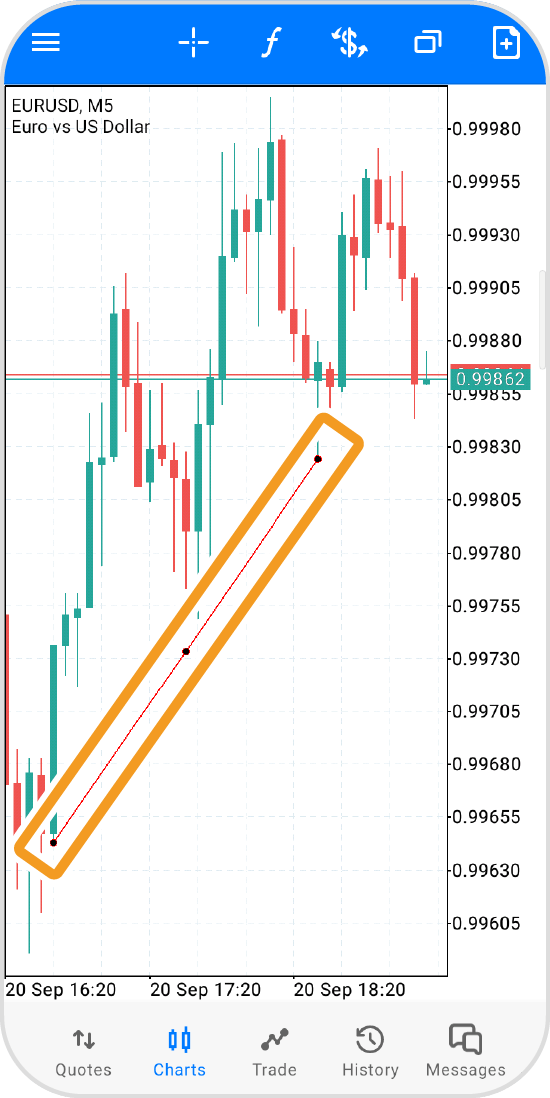
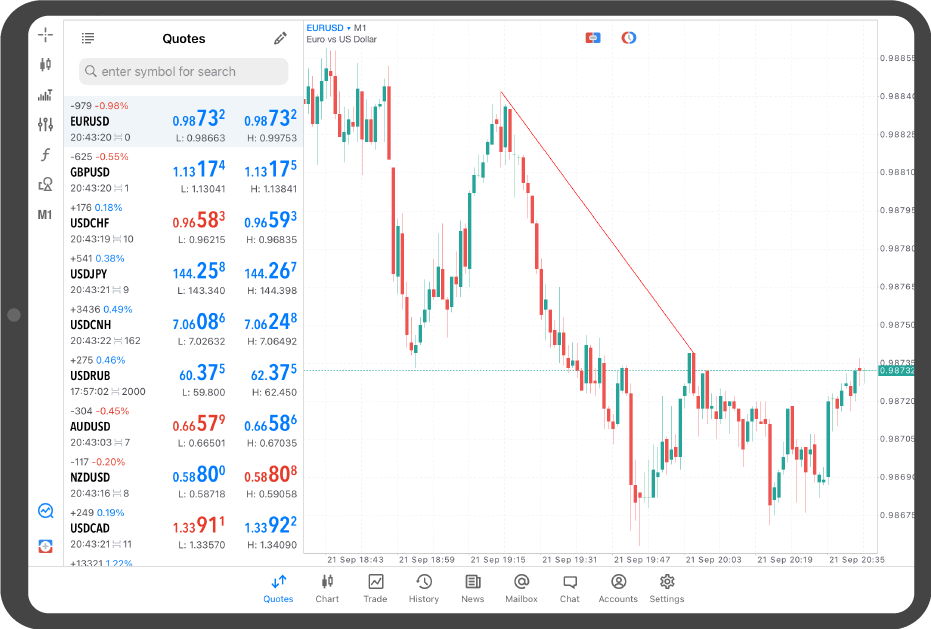
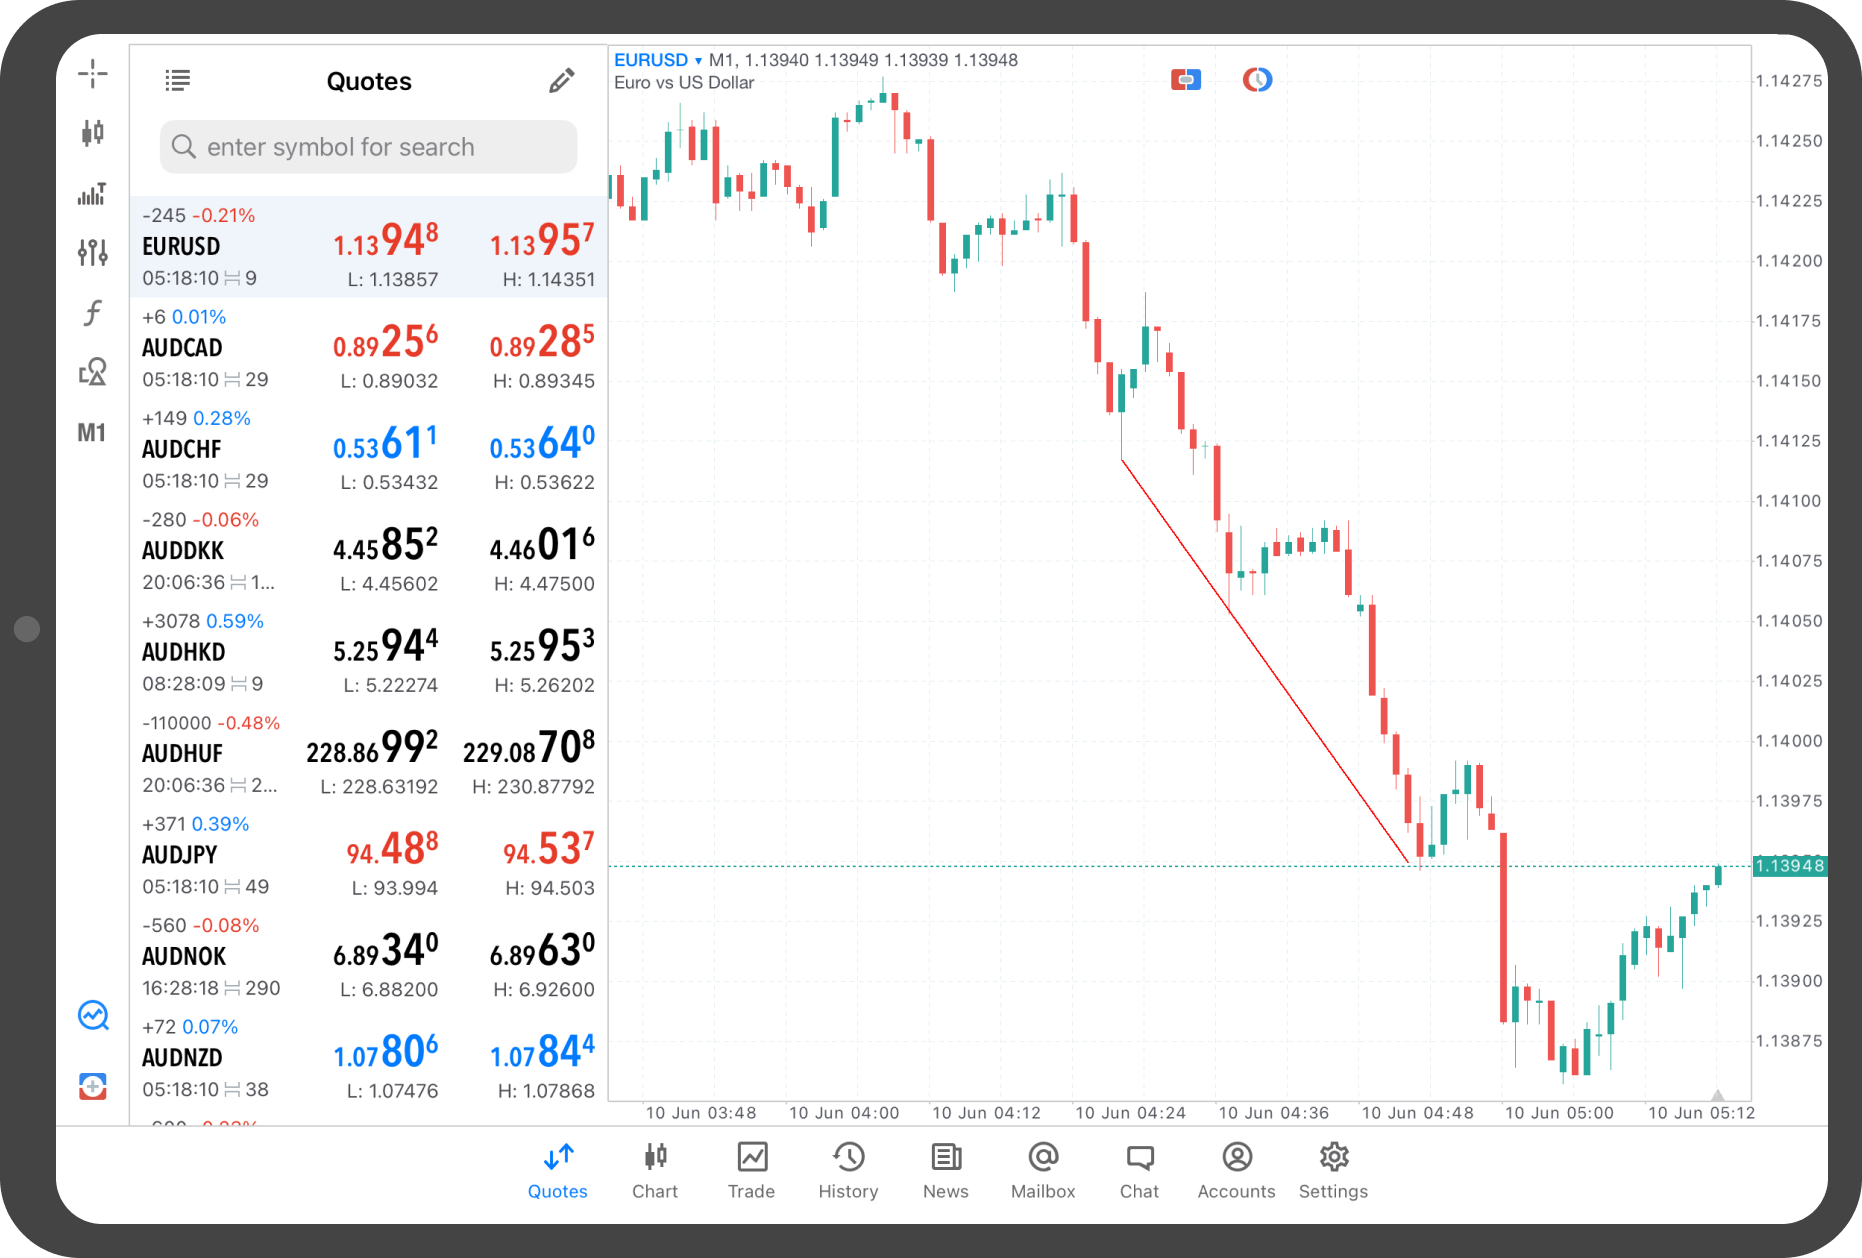
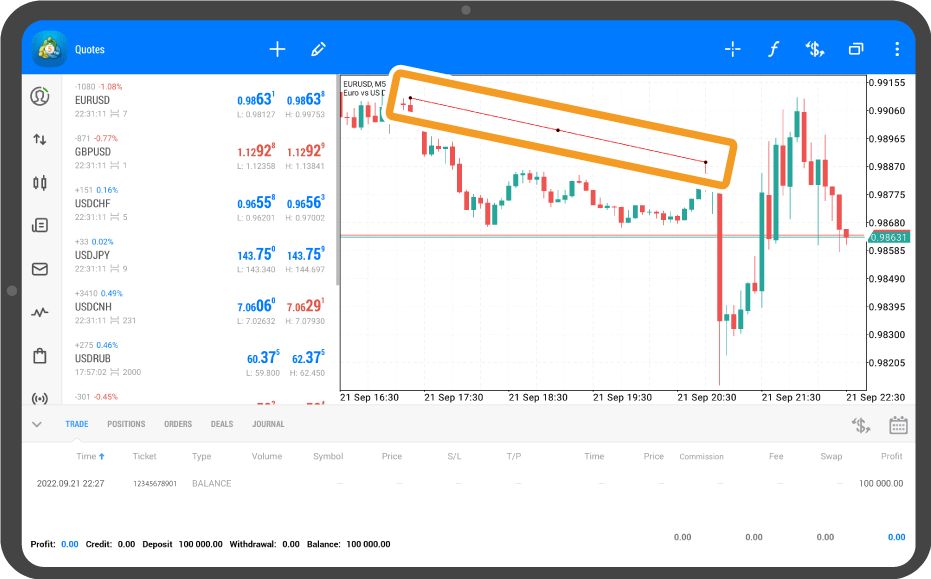
Tap at the starting point and drag to the end point.
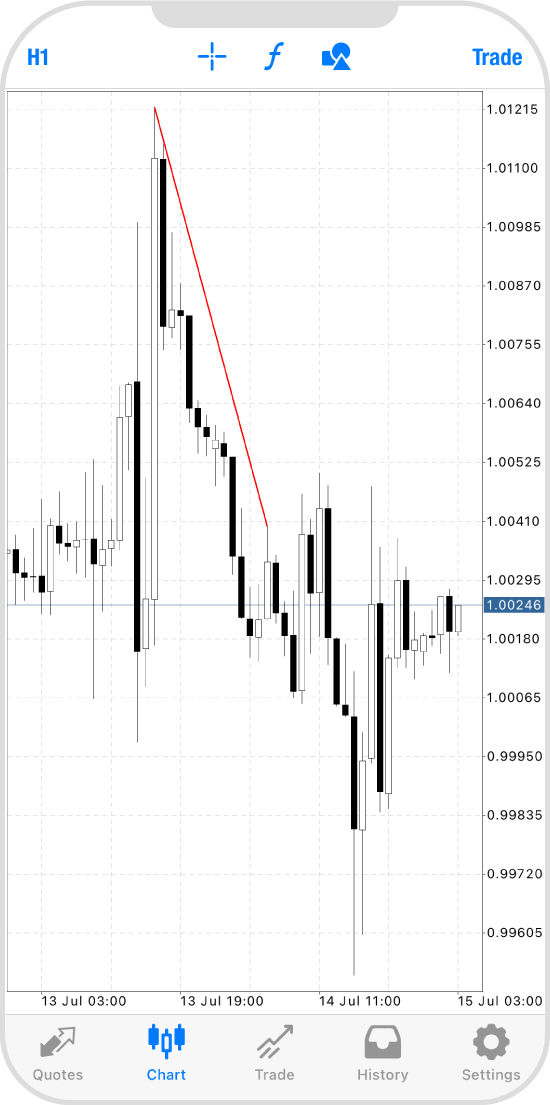
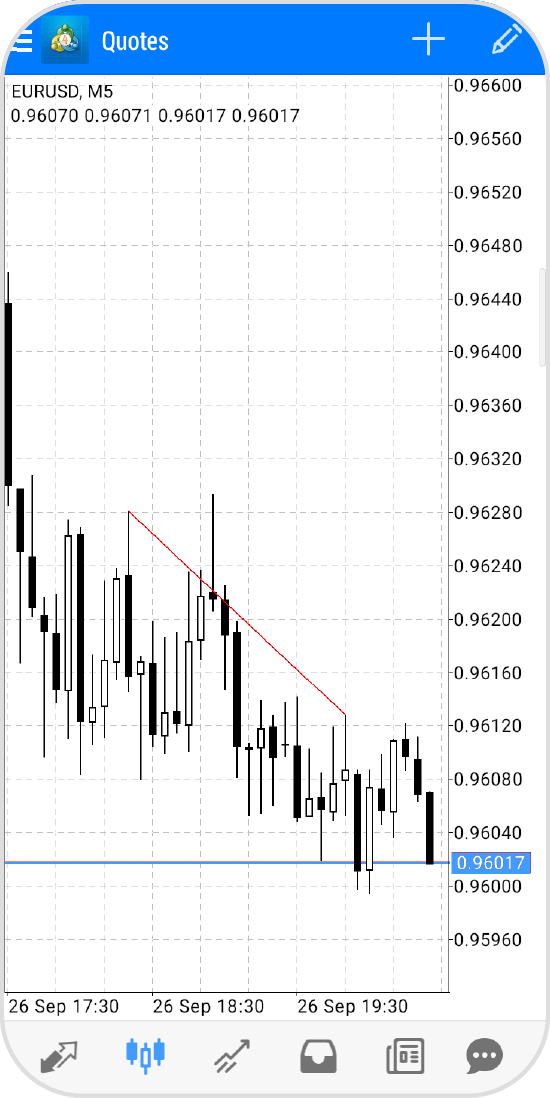
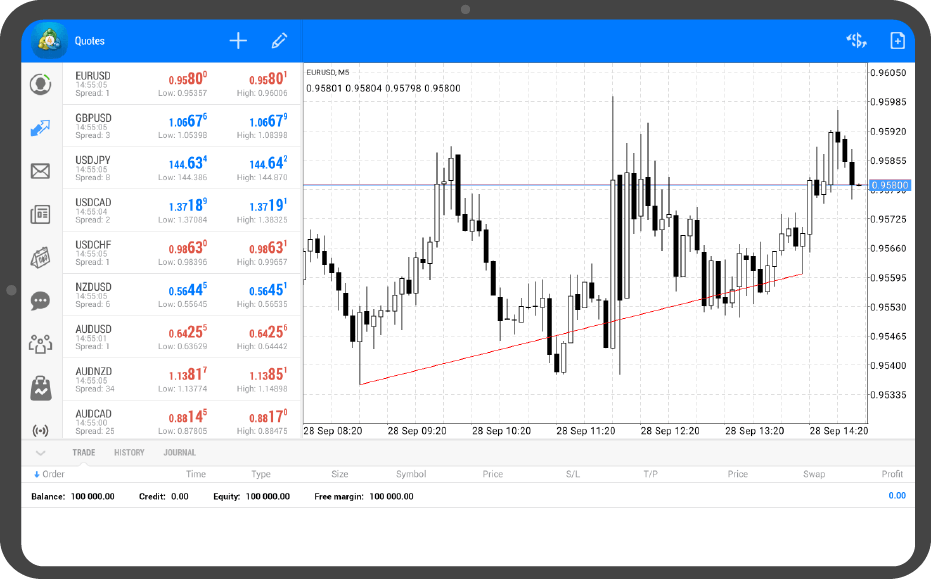
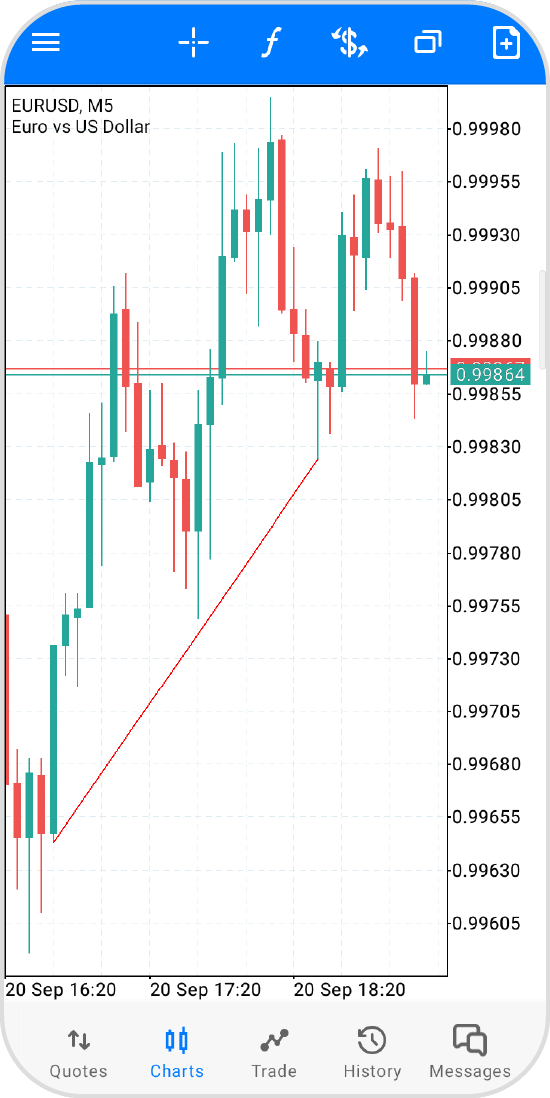
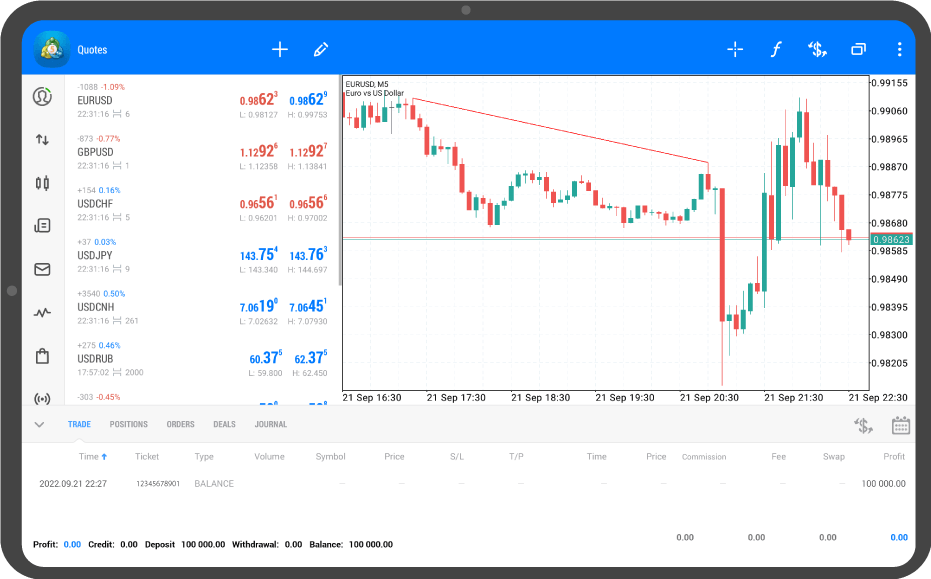
To fix the trendline, tap on the line to hide the dots.
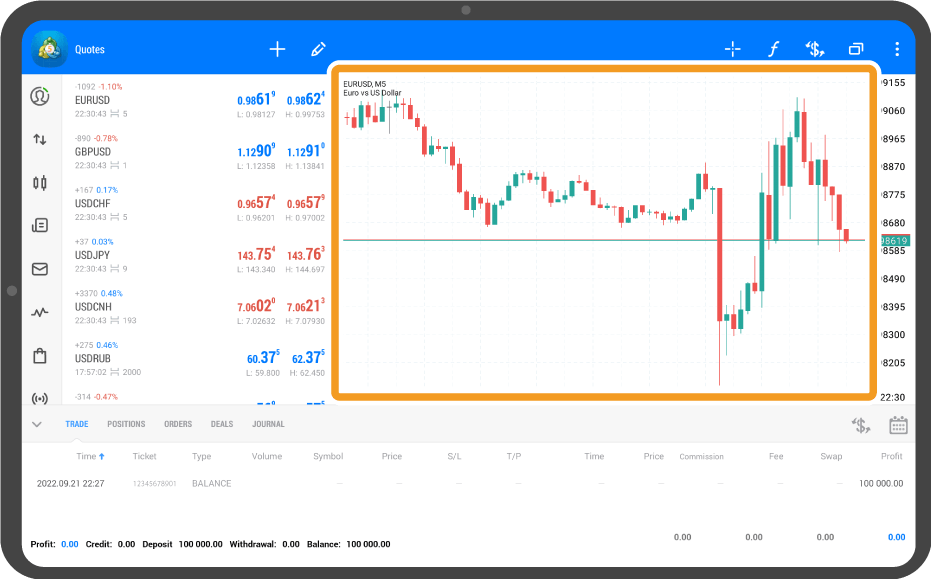
Tap "Chart" on the bottom navigation bar.
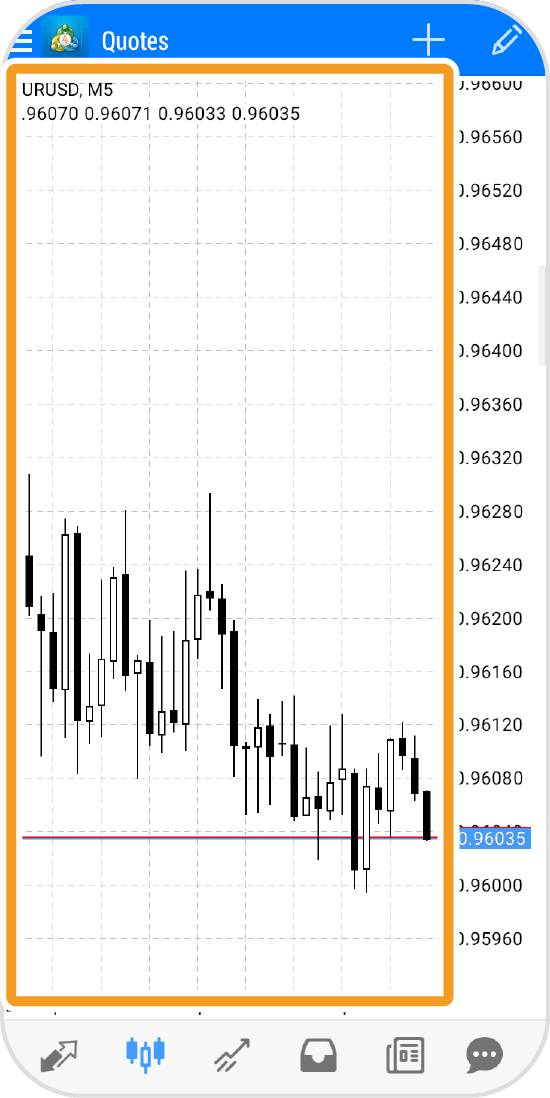
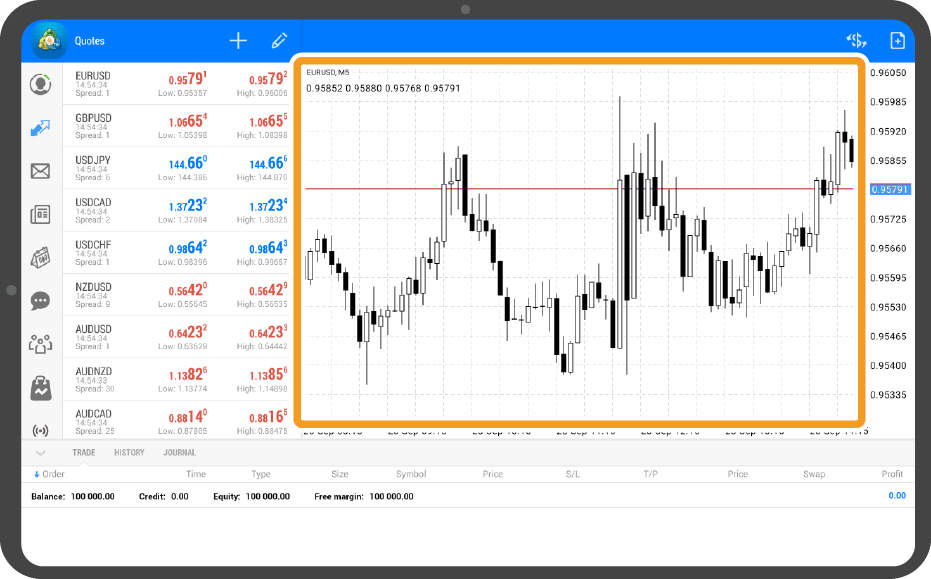
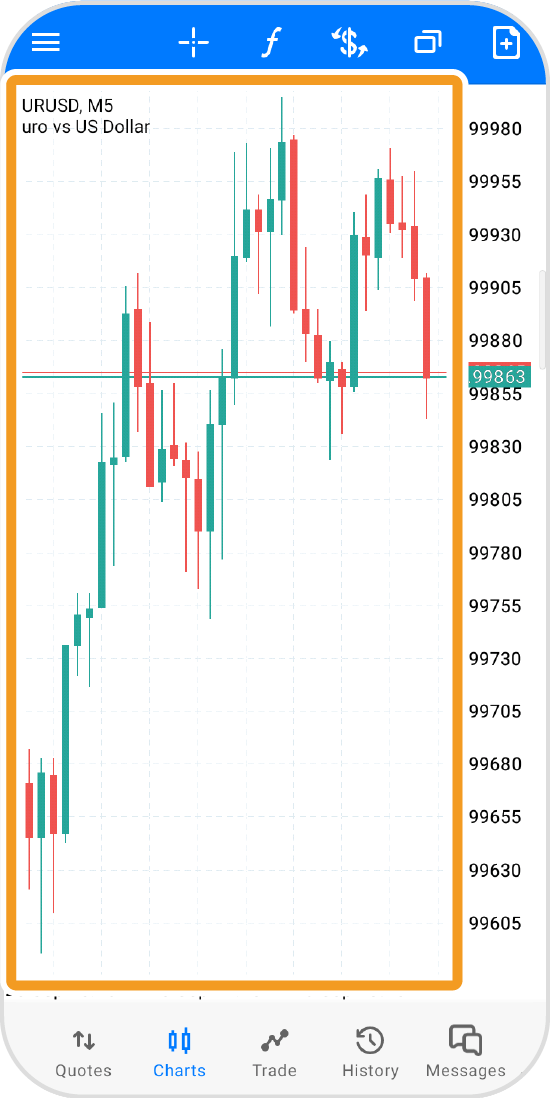
Tap on the chart.
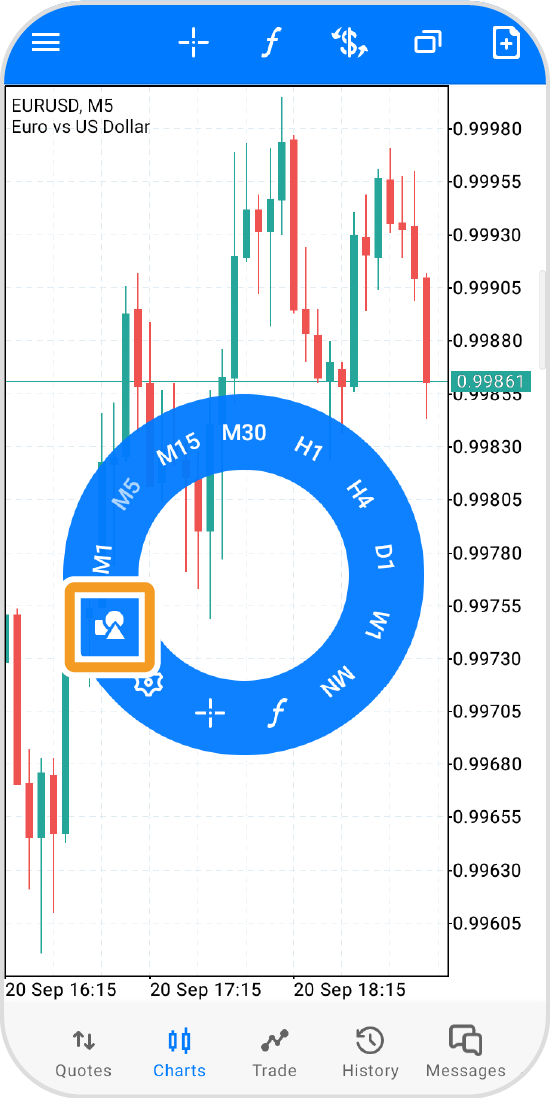
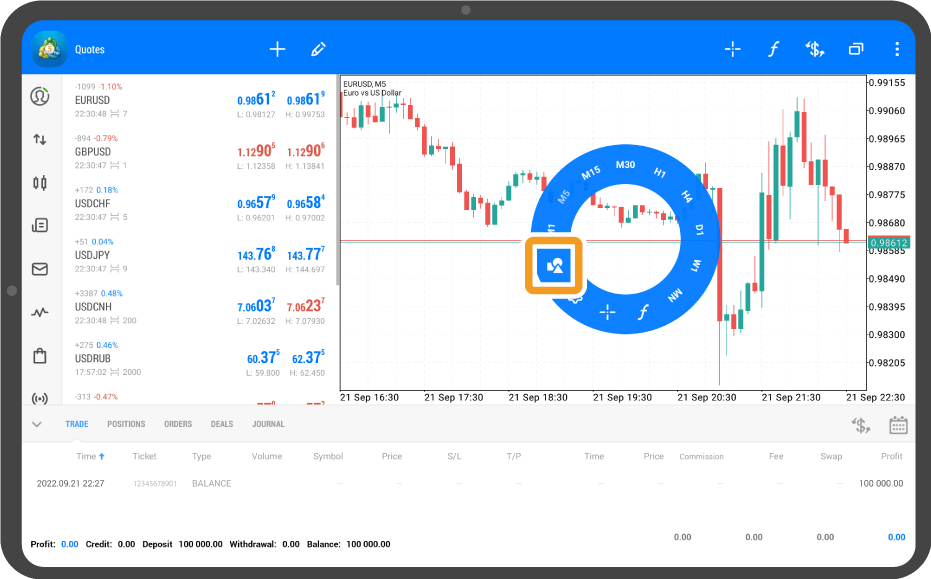
Tap the "Objects" icon.
Tap "+" in the top right corner.
Tap at the starting point and drag to the end point.
Tap at the starting point of the trendline and drag to the end point.
To fix the trendline, tap around it and hide the black dots.

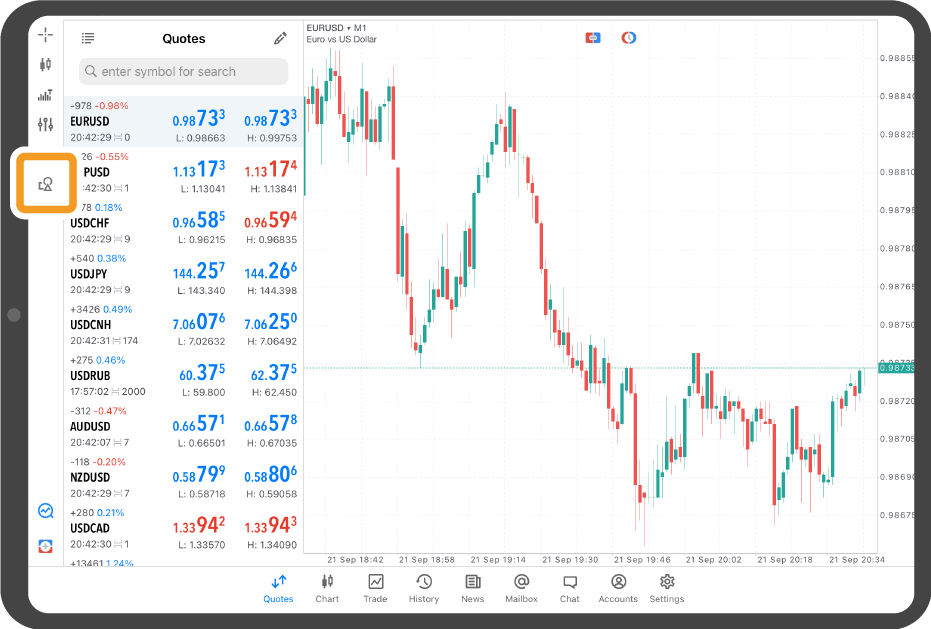
Tap the "Objects" icon on the left.
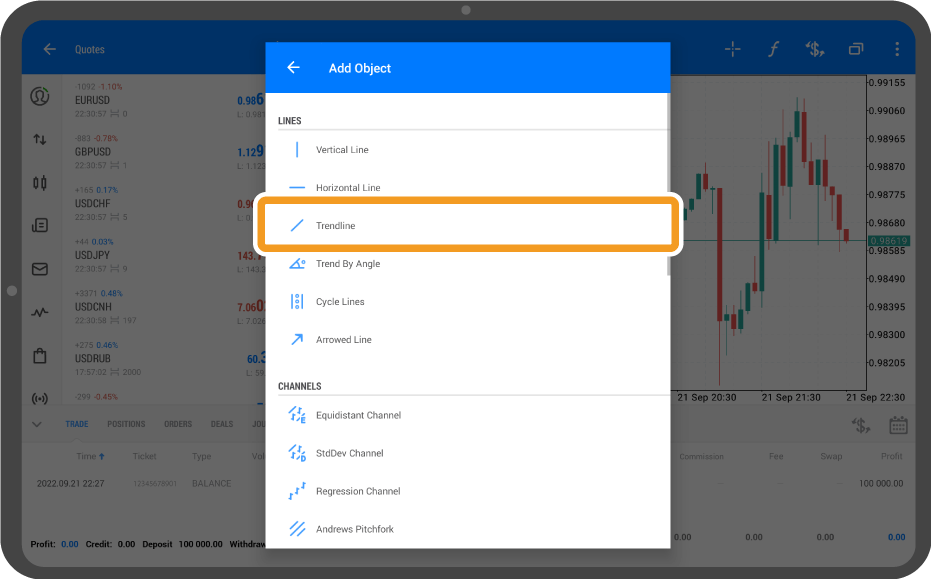
Tap "Add Object".
Tap "Trendline".
Tap at the starting point of the trendline and drag to the end point.
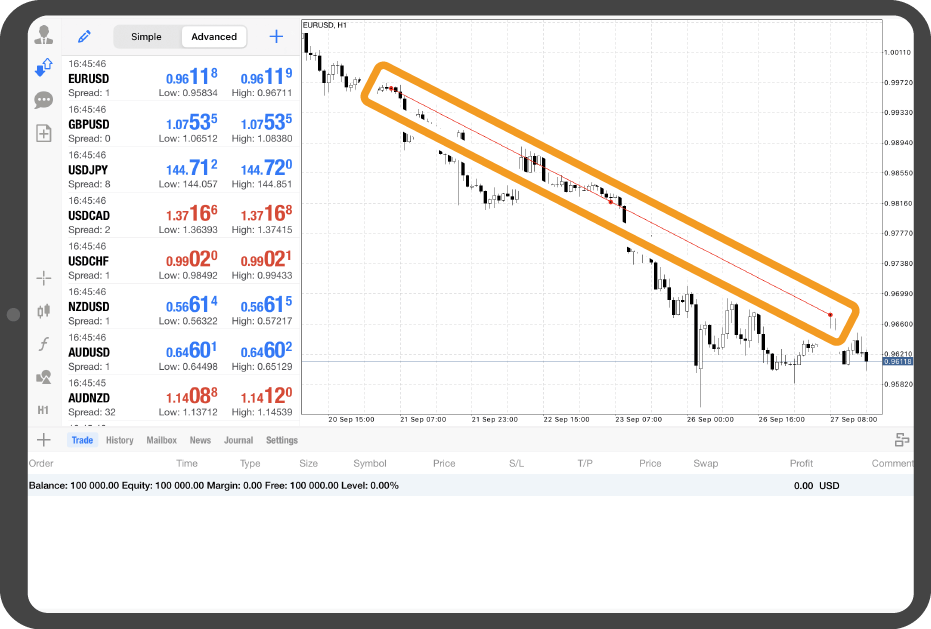
To fix the trendline, tap around it and hide the red dots.
Tap on the chart.
Tap the "Objects" icon.
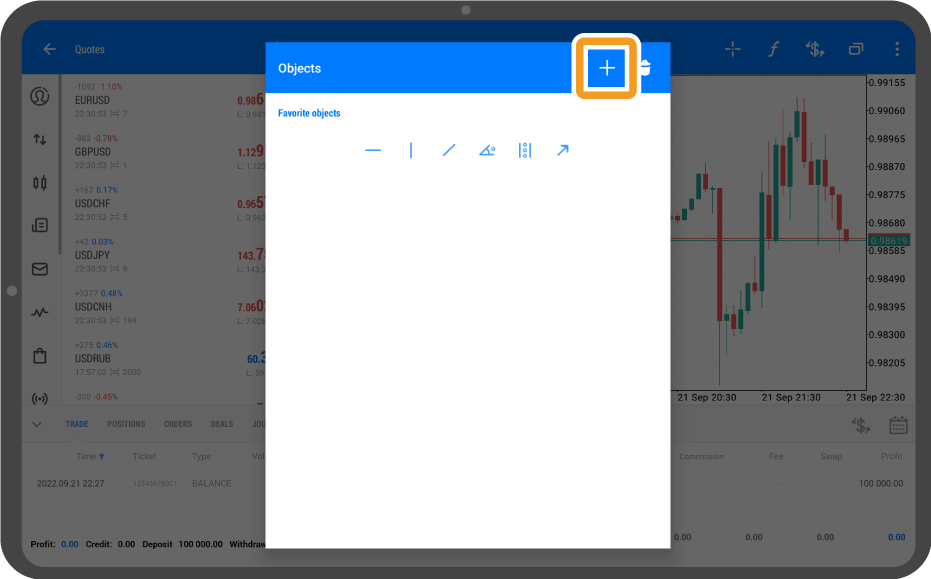
The list of objects on the chart will be displayed. Tap "+" in the top right corner.
Tap at the starting point and drag to the end point.
Tap at the starting point of the trendline and drag to the end point.
To fix the trendline, tap around it and hide the black dots.

Tap "Chart" on the bottom navigation bar.
Tap the "Objects" icon at the top.
Tap "Add Object".
Tap "Trendline".
Tap at the starting point and drag to the end point.
In the menu that appears after swiping, you can also change the line's color, thickness, and style.
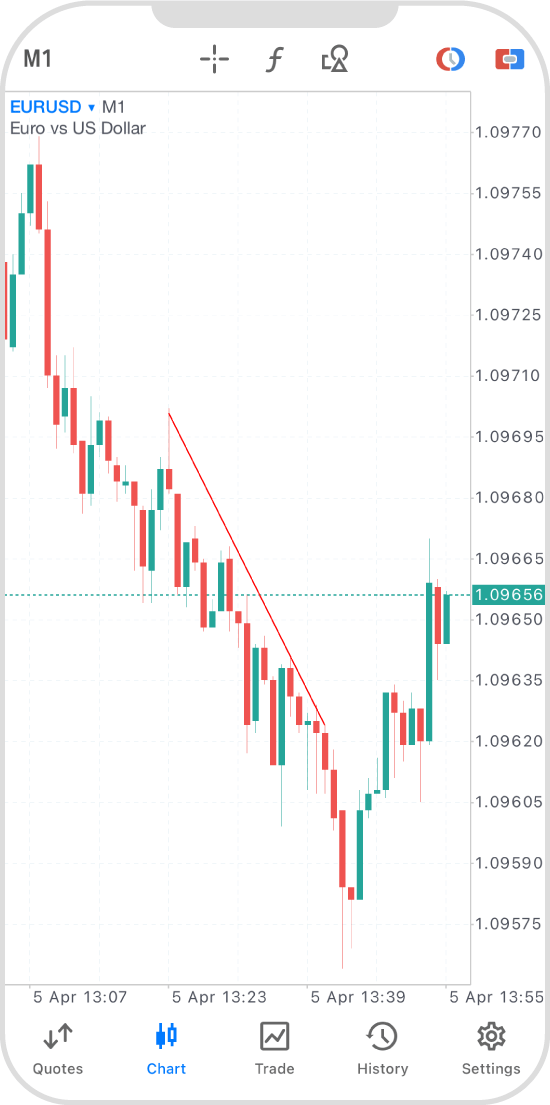
To fix the trendline, tap on the line to hide the dots.
Tap "Charts" on the bottom navigation bar.
Tap on the chart.
Tap the "Objects" icon.
Tap the "+" icon at the top.

Tap "Trendline".
Tap at the starting point of the trendline and drag to the end point.
To fix the trendline, tap around it and hide the black dots.
Tap the "Objects" icon on the left.
Tap "Add Object".
Tap "Trendline".
Tap at the starting point of the trendline and drag to the end point.

In the menu that appears after swiping, you can also change the line's color, thickness, and style.
To fix the trendline, tap around it and hide the red dots.
Tap on the chart.
Tap the "Objects" icon.
Tap the "+" icon at the top.
Tap "Trendline".
Tap at the starting point of the trendline and drag to the end point.
To fix the trendline, double-tap around it and hide the black dots.
![]()
Created
: 2022.10.03
![]()
Last updated
: 2026.05.29

Nakamaru is a manual production consultant at FINTECS, a company that specializes in creating manuals for their clients.
With a wide range of experience from fintech to entertainment, he presents what user-friendly manuals should be like.
He works with numerous large corporations as an external manual production project manager.
【Business information】
http://www.fintecs.co.jp/profile/
Akira Takagi
Systems engineer, MetaTrader administrator

After graduating from Computer Science at the Uninove, Brazil, in 2014, he has worked on various systems development projects.
He participated as a developer in the launch of forex services in 2019. Since then, he has also been involved in the development of MetaTrader plugins and APIs. He is certified by MetaQuotes as a MetaTrader5 Administrator and active in consulting and advisory as well.
We hope you find this article useful. Any comments or suggestions will be greatly appreciated.
We are also looking for writers with extensive experience in forex and crypto to join us.
please contact us at [email protected].

MT4/MT5: Lock or hide objects
![]() 2025.09.12
2025.09.12
![]() 2026.07.09
2026.07.09
Here we'll look over the steps on how to lock or hide objects in MetaTrader4 (MT4) / MetaTrader5 (MT5) app for Android and iOS devices. Locking an object prevents it from being accidentally moved or deleted. You can also hide objects to improve chart visibility.

MT4/MT5: Draw Fibonacci fan
![]() 2022.11.02
2022.11.02
![]() 2026.07.09
2026.07.09
Here we'll look over the steps on how to display the Fibonacci fan on the chart in MetaTrader4 (MT4) / MetaTrader5 (MT5) app for Android and iOS mobile devices. Fibonacci fan uses the trendline and draws 3 separate lines using the Fibonacci ratio. Use these lines to determine the dip/rally, as well as a breakpoint that signals a trend change.
MT4/MT5: Draw Fibonacci arcs
![]() 2022.11.02
2022.11.02
![]() 2026.07.09
2026.07.09
Here we'll look over the steps on how to display the Fibonacci arcs on the chart in MetaTrader4 (MT4) / MetaTrader5 (MT5) app for Android and iOS mobile devices. Fibonacci arc is a technical indicator that utilizes the Fibonacci ratio on the price gap and time. Connect the high and low and it will draw 3 arcs relative to the end point using the Fibonacci ratio. It is one of the Fibonacci analysis methods that incorporate time, and is the same in concept as the Fibonacci retracement.

MT4/MT5: Draw Fibonacci channel
![]() 2022.11.02
2022.11.02
![]() 2026.07.09
2026.07.09
Here we'll look over the steps on how to display the Fibonacci channel on the chart in MetaTrader4 (MT4) / MetaTrader5 (MT5) app for Android and iOS mobile devices. Fibonacci channel uses the trendline and creates parallel channel lines using the Fibonacci ratio. Use these lines to predict support and resistance levels and to determine a take-profit level after a channel breakout.

MT4/MT5: Draw Fibonacci expansion
![]() 2022.11.02
2022.11.02
![]() 2026.07.04
2026.07.04
Here we'll look over the steps on how to display the Fibonacci expansion on the chart in MetaTrader4 (MT4) / MetaTrader5 (MT5) app for Android and iOS mobile devices. This tool draws horizontal lines using the Fibonacci ratio when connecting the starting point of the trend and the dip/rally points. Use these as reference points to determine how far the market will expand.

MT4/MT5: Draw Elliott motive wave
![]() 2022.11.02
2022.11.02
![]() 2026.07.09
2026.07.09
Here we'll look over the steps on how to display the Elliott motive wave on the chart in MetaTrader4 (MT4) / MetaTrader5 (MT5) app for Android and iOS mobile devices. The Elliott Wave, an analysis method developed by Ralph Nelson Elliott (USA), states that markets have a cycle. The Elliott motive wave moves in the same direction as the one larger trend and is useful when identifying major market trends.
Disclaimer:![]()
All information and content provided on this website is provided for informational purposes only and is not intended to solicit any investment. Although all efforts are made in order to ensure that the information is correct, no guarantee is provided for the accuracy of any content on this website. Any decision made shall be the responsibility of the investor and Myforex does not take any responsibility whatsoever regarding the use of any information provided herein.
The copyright in our content belongs to us.
We welcome your use of our content within appropriate limits, including use through our sharing features, sharing on social media, and quotation. However, please refrain from unauthorized reuse, including but not limited to commercial use, reproduction with modification of content, or reproduction on websites that compete with us. We may take necessary measures, including but not limited to deletion of the relevant content, if we consider that the content has been used in an inappropriate or unauthorized manner.
Myforex uses cookies to improve the convenience and functionality of this website. This website may include cookies not only by us but also by third parties (advertisers, log analysts, etc.) for the purpose of tracking the activities of users. Cookie policy
