Created
: 2024.09.27


![]() 2024.09.27 07:05
2024.09.27 07:05
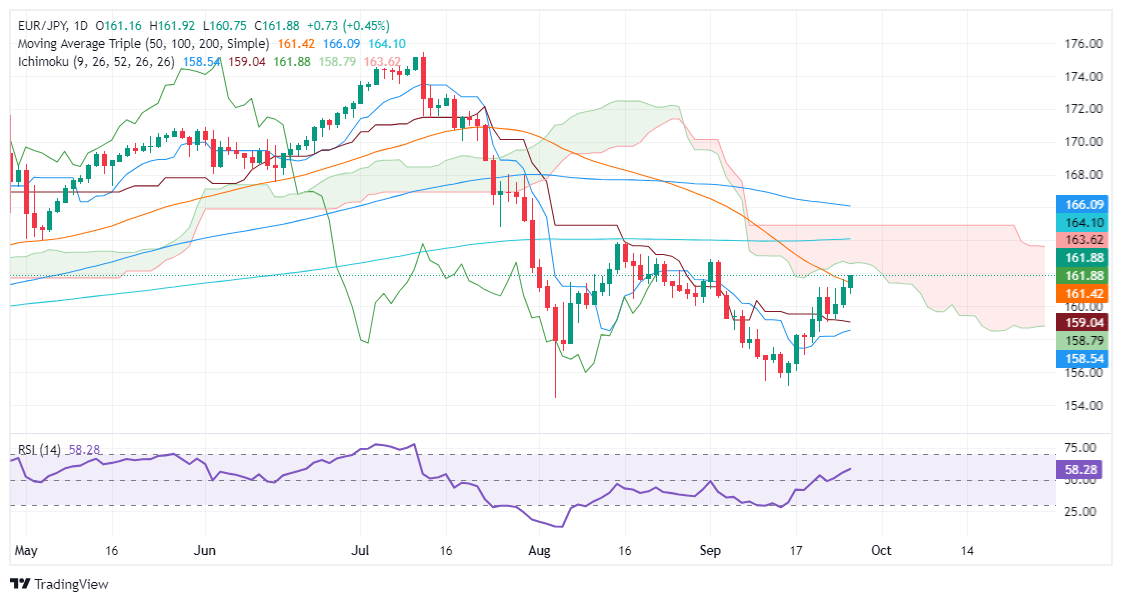
The EUR/JPY printed solid gains of over 0.40% on Thursday, extending its rally to three consecutive days. Data from the United States (US) improved risk appetite and consequently weighed on the Japanese Yen due to its safe-haven status. At the time of writing, the cross-pair trades at 161.79.
The EUR/JPY uptrend remains intact, although the pair aimed higher to the bottom of the Ichimoku Cloud (Kumo) after surpassing the 50-day moving average (DMA) at 161.19.
Momentum hints that buyers are losing some steam, as depicted by the Relative Strength Index (RSI) slope turning flat, meaning the consolidation lies ahead.
If EUR/JPY clears the bottom of the Kumo at around 162.45/65, the next resistance level would be the Senkou Span B at 163.13, followed by the 200-day moving average (DMA) at 164.10.
Conversely, if EUR/JPY dives below the September 26 low of 160.74, the next support would be the confluence of the September 24 daily low of and the Tenkan Sen at around 158.99/98
The table below shows the percentage change of Euro (EUR) against listed major currencies today. Euro was the strongest against the Australian Dollar.
| USD | EUR | GBP | JPY | CAD | AUD | NZD | CHF | |
|---|---|---|---|---|---|---|---|---|
| USD | 0.00% | 0.00% | 0.01% | 0.01% | 0.03% | -0.00% | -0.04% | |
| EUR | -0.00% | -0.01% | 0.00% | -0.03% | 0.03% | -0.02% | -0.04% | |
| GBP | -0.00% | 0.01% | 0.02% | -0.01% | 0.04% | 0.00% | -0.03% | |
| JPY | -0.01% | 0.00% | -0.02% | -0.01% | 0.04% | -0.01% | -0.01% | |
| CAD | -0.01% | 0.03% | 0.00% | 0.00% | 0.00% | 0.00% | -0.04% | |
| AUD | -0.03% | -0.03% | -0.04% | -0.04% | -0.01% | -0.02% | -0.05% | |
| NZD | 0.00% | 0.02% | -0.01% | 0.01% | -0.00% | 0.02% | -0.04% | |
| CHF | 0.04% | 0.04% | 0.03% | 0.01% | 0.04% | 0.05% | 0.04% |
The heat map shows percentage changes of major currencies against each other. The base currency is picked from the left column, while the quote currency is picked from the top row. For example, if you pick the Euro from the left column and move along the horizontal line to the US Dollar, the percentage change displayed in the box will represent EUR (base)/USD (quote).
![]()
Created
: 2024.09.27
![]()
Last updated
: 2024.09.27

FXStreet is a forex information website, delivering market analysis and news articles 24/7.
It features a number of articles contributed by well-known analysts, in addition to the ones by its editorial team.
Founded in 2000 by Francesc Riverola, a Spanish economist, it has grown to become a world-renowned information website.
We hope you find this article useful. Any comments or suggestions will be greatly appreciated.
We are also looking for writers with extensive experience in forex and crypto to join us.
please contact us at [email protected].
Disclaimer:![]()
All information and content provided on this website is provided for informational purposes only and is not intended to solicit any investment. Although all efforts are made in order to ensure that the information is correct, no guarantee is provided for the accuracy of any content on this website. Any decision made shall be the responsibility of the investor and Myforex does not take any responsibility whatsoever regarding the use of any information provided herein.
The content provided on this website belongs to Myforex and, where stated, the relevant licensors. All rights are reserved by Myforex and the relevant licensors, and no content of this website, whether in full or in part, shall be copied or displayed elsewhere without the explicit written permission of the relevant copyright holder. If you wish to use any part of the content provided on this website, please ensure that you contact Myforex.
Myforex uses cookies to improve the convenience and functionality of this website. This website may include cookies not only by us but also by third parties (advertisers, log analysts, etc.) for the purpose of tracking the activities of users. Cookie policy
